
 Worksheets
Big AP Stats Review (#1)
Total questions: 76
Worksheet time: 3hrs 5mins
The entire collection of individuals or objects about which information is desired is called a sample.
True
False
Methods for summarizing data make up the branch of statistics called
Descriptive Statistics
Inferential Statistics
Probability
A primary use of inferential statistics is to make generalizations from a sample to a population.
True
False
A data set is discrete if the possible values are isolated points on the number line.
True
False
Frequency distributions can be used with _______ data.
Categorical
Quantitative
Both Categorical & Quantitative
The relative frequency for a particular category is the number of times the category appears in the data.
True
False
Dotplots work best for small and moderate sized numerical data sets.
True
False
Bar charts should be used with categorical data.
True
False
A data set consisting of many observations of a single characteristic is a categorical data set.
True
False
A data set is multivariate if it consists only of numeric variables.
True
False
By definition, a simple random sample of size n is any sample that is selected in a manner to guarantee every individual in the population has an equal chance of selection.
True
False
Clusters are non-overlapping subgroups of a population that have been identified as homogeneous.
True
False
Blocking is a technique that can be used to filter out the effects of extraneous (confounding) factors.
True
False
Response bias can occur when responses are not actually obtained from all individuals selected for inclusion in the sample.
True
False
Selection bias can occur if volunteers only are used in a study.
True
False
Increasing sample size will generally eliminate bias in a sample.
True
False
A study is an observational study if the investigator observes the behavior of a response variable when one or more factors are manipulated.
True
False
As long as the sample size is small relative to the population, there is little practical difference between sampling with replacement and sampling without replacement.
True
False
A treatment is any particular combination of values for the explanatory variables.
True
False
Two factors are confounding if their effects on the response variable cannot be distinguished from one another.
True
False
Random assignment to treatments will guarantee groups that are exactly alike for experimental purposes.
True
False
Random assignment of volunteers should result in comparable experimental groups.
True
False
Replicating in an experiment means that the number of subjects is greater than 1.
True
False

How is the data distributed in this histogram?
Symmetrically
Skewed Right
Skewed Left
You have a mean of 56 and a standard deviation of 4.3. What is +2 standard deviations from the mean?
60.3
47.4
51.7
64.6
6, 7, 2, 1, 5, 2, 1, 6
Which is the symbol for sample mean?
x̄
μ
n
Σ


How is the data distributed in this histogram?
Symmetrically
Skewed Right
Skewed Left
You have a mean of 56 and a standard deviation of 4.3. What is +2 standard deviations from the mean?
60.3
47.4
51.7
64.6
6, 7, 2, 1, 5, 2, 1, 6
To select a cluster sample, divide a population into groups, then select all the members in some of the groups.
True
False
Using a stratified sample guarantees that members of each group within a population will be sampled.
True
False












2, 5, 12, 15, 19, 4, 6, 11, 16, 18, 12, 12, 42
What effect does removing the outlier have on the distribution of the data?
56, 64, 73, 59, 98, 65, 59
If the outlier is removed from the data set, which measure of central tendency will be least affected?



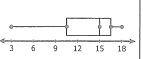

What is the shape of the distribution?
Skewed Left
Skewed Right
Symmetric


When using IQR to find outliers, which formula will identify the lower limit?
Q3 - 1.5(IQR)
Q1 + 1.5(IQR)
Q1 - 1.5(IQR)
Q3 + 1.5(IQR)
The salaries of the employees in a company are listed below:
$28,000 $45,000
$31,000 $42,000
$55,000 $72,000
$88,000 $53,000
If $88,000 was found to be an outlier, which salary would be the new maximum?
$55,000
$28,000
$88,000
$72,000
Find the median, first quartile, third quartile, and interquartile range of the data.
32, 53, 72, 66, 47, 54, 49, 67, 71
Median: 54
First Quartile: 49
Third Quartile: 67
IQR: 18
Median: 54
First Quartile: 48
Third Quartile: 69
IQR: 21
Median: 54
First Quartile: 48
Third Quartile: 69
IQR: 22
Median: 54
First Quartile: 49
Third Quartile: 69
IQR: 20
84, 88, 72, 74, 98, 16, 94
Q1 = 53
Q2 = 55
Q3=61

