
 Worksheets
Natural Selection and Hardy Weinberg Practice
Total questions: 13
Worksheet time: 22mins

Which of the following best describes what the image represents? (a)

Green rhinocerous beetles are some of the biggest beetles to exist on Earth. A green rhinocerous beetle leaves its group and wonders over to another group that only has red rhinocerous beetles and mates with the red beetles. This is an example of:
Gene Flow
Genetic Drift
Mutation
Migration
Adaptations can be:
camouflage
ability to survive cold weather
hunting skills
all of the above

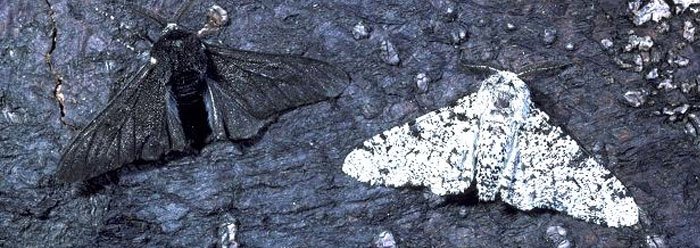
What is most likely to happen to moth populations in the picture shown?
Light moths--hunted easily, dark moths--population increase
Dark moths--hunted easily, dark moths--population increase
Light moths--hunted easily, light moths--population increase
Lights moths will change their color to match dark moths.

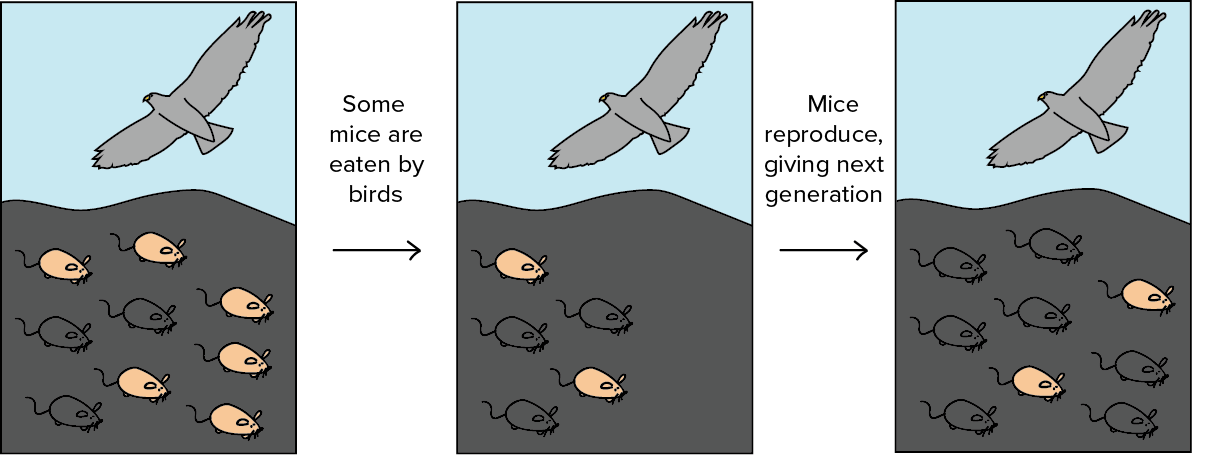
Due to pollution, a pond becomes darker over time. Which trait variation became more common?
light fish
dark fish
Mutation
Change in DNA sequence
Gene Flow
Increases genetic variation
Genetic Drift
Usually decreases genetic variation
Bottle Neck
Population gets smaller (Natural Disaster)
Founders Effect
Starting a new population

What type of genetic drift is this picture showing? (a)
Select ALL of the following that violate the Hardy-Weinberg assumptions and would lead to a change in allele frequencies in a population.
natural selection
large population
no mutations
nonrandom mating
no migration
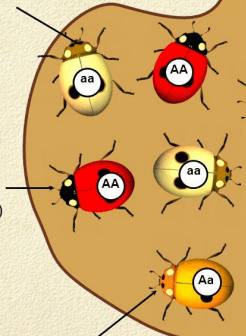
Calculate the frequency of the dominant allele in this population of beetles. Make sure to write your answer in decimal form. (Example: 0.2)
(a)
0.8 + q = 1 What's the missing value?
(a)
A rather large population of foxes has 84 individuals with tan fur and 16 individuals with red fur. Assume that red is recessive.
What is the frequency of the homozygous dominant genotype in the fox population?
(a)

