
 Worksheets
Statistics and Probability RISE Review
Total questions: 37
Worksheet time: 1hrs 14mins


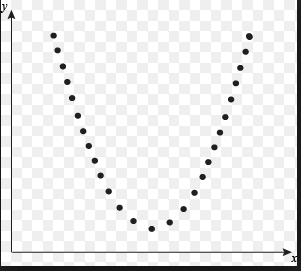
What type of correlation does this scatterplot display?
Positive
Negative
No Correlation




Is this line an accurate line estimate of best fit for the data?
Yes
No

What is the equation of the line of best fit
y= -2x + 10
y= 10x+ 2
y= 10

Which line is the best line of best fit?
a
b
c
i don't see any lines

What are the coordinates of the outlier?
(1,9)
(9,1)
(2,2)
y=x

What is the equation of the line of best fit?
y= 2x
y=3x+7
y= 21x +3
y= −21x −3

Which scatter plot shows a linear relationship between x and y?
Graph A
Graph B
Graph C
Graph D
What is the equation of the line of best fit?
y= 2x+3
y=3x+2
y= 21x +3
y= −21x +3



What percentage of males drive sports cars?
(a)


How many people purchased no food and no drink?
(a)

How many total people were surveyed about what ice cream flavor they would pick?
(a)

What percent of the total population surveyed were electrical engineers that like math? Round to tenths.
(a)

What percent of people who play an instrument do not play a team sport? Round to tenths.
(a)
What percent of people who bought no food purchased water? Round to tenths.
(a)


The table shows the different types of engineers and the subject they liked most. What percentage of people surveyed were chemical engineers who preferred math? Round to tenths.
(a)


What percent of 10th graders liked SpongeBob SquarePants?
(a)

What was the percentage of just 11th graders who liked Rick? Round to whole number.
(a)

How many people were surveyed? BE CAREFUL AND LOOK AT THE TABLE COMPLETELY.....MAYBE DRAW IT TOO....
52
60
150
77

