
 Worksheets
M1 Unit 6 Review (Statistics)
Total questions: 101
Worksheet time: 3hrs 26mins
The mean of a data set can be found by...
subtracting the minimum from the maximum
choosing the middle number
choosing the number that occurs most
finding the sum of the numbers and then dividing by the total amount of numbers in the data set
The median of a data set can be found by...
subtracting the minimum from the maximum
choosing the middle number
choosing the number that occurs most
finding the sum of the numbers and then dividing by the total amount of numbers in the data set
The mode of a data set can be found by...
subtracting the minimum from the maximum
choosing the middle number
choosing the number that occurs most
finding the sum of the numbers and then dividing by the total amount of numbers in the data set
The range of a data set can be found by...
subtracting the minimum from the maximum
choosing the middle number
choosing the number that occurs most
finding the sum of the numbers and then dividing by the total amount of numbers in the data set
The median of the numbers 34, 32, 12, 65, and 45 is...
34
32
12
65
There can be more than one mean
True
False
There can be more than one mode
True
False
What is the first step when looking at data?
Find the mean
Put them in order from least to greatest
Sort the data into categories
Find the range
What is the range of 45, 56, 23, 74, and 63?
18
51
23
56
Find the mean of 1, 2, 3, 4, and 5
7
3
4
2
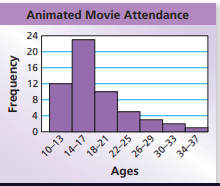
What is the shape of the data?
symmetrical
skewed left
skewed right
bell curve

What is the shape of the data?
symmetrical
skewed left
skewed right
bell curve

What is shape of the data?
symmetrical
skewed left
skewed right
bell curve

What is the shape of the data?
symmetrical
skewed left
skewed right
bell curve
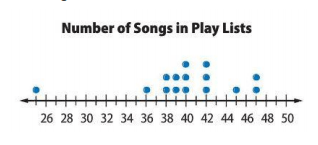
Which statement best describes this graph?
There is a peak at 47.
There is a cluster around 38-40.
The mode is 40.
There is a gap in the data between 39-40.

Which statement best describes this graph?
There is a peak at 2.
There is a gap in the data.
Most people own 1 pet.
There is no mode.

Which statement best describes this graph?
The graph is symmetrical.
There is a cluster of data between 23 and 25.
The spread is 10.
The most students sold 25 magazines.

Which statement best describes the graph?
The data is skewed left.
The data is symmetrical.
There is a peak between 10 and 14 hours.
There is a cluster between 5 and 9

What is the spread of the data?
4
10
19
9

Where is the gap in the data?
between 23 and 25
between 17 and 20
at 18
at 22
A data distribution that is Uniform ...
Looks like a Square
Looks like a Triangle
Looks like a Parallelogram
Looks like a Rectangle

What is the shape of the distribution?
Skewed Left
Skewed Right
Symmetric
Uniform

What is the shape of the distribution?
Skewed Left
Skewed Right
Symmetric
Uniform

What is the shape of the distribution?
Symmetrical
Uniform
Skewed Right
Skewed Left

Describe the clusters in this distribution.
There is a cluster from 2.2-2.6
There is no cluster because the data is all together.

Describe the gaps in the distribution.
There are no gaps in the data.
There is a gap at 2.7
There is a gap at 2.1

Describe the outliers in the distribution.
There is an outlier at 2.8
There is an outlier at 2.4
There are no outliers.

What percent of people who attended the basketball game also attended the school play?
38%
47%
25%
54%

What number should go in the blue box?
21
135
19
22

How many total have no cell phone?
13
9
22
100

How many total people were surveyed?
78
22
70
100


What percent of all students were females who prefer football?
16%
80%
8%
12%

According to this table, how many males walk to work?
80
221
34
141

How many children prefer vanilla ice cream?
78
131
26
105

How many adults took this survey?
52
41
93
131

How many total people were surveyed?
224
448
131
146
Match the following term to its definition.
Center
The one number that summarizes data by giving the middle or center value. Measured by mean or median
Skewed data
When a set of data is not symmetrical, it can be skewed
Spread
The one number that summarizes the variation in the data. Measured by the range.
Overall shape
The frequency of data and any data that is skewed to the left or right.
(a) : the "average" value for the data.
(b) : the value for which half the numbers are larger and half are smaller.
(c) : To find, subtract the smallest value from the largest value in a set of data.
(d) : The difference of the values of the first and third quartiles.
(a) : The center number between the minimum value and the median.
(b) : The center number of the entire data set.
(c) : The center number between the median and the maximum value.
Match the following display to its name.

Box Plot

Dot Plot

Histogram
This list shows the number of math problems solved each week by a sixth grade student.
23, 19, 26, 20, 31, 16, 20, 29, 27
Which box plot BEST represents this list?


The dot plot shows the number of times 14 students have attended a sporting event.
What number is the median of the data set?
1
4
5
7
Which question is a statistical question because it could have more than one answer?
Where does the current US president live?
What size coat am I wearing today?
Did Jack wear sneakers or boots to school today?
What size shirt do the kids in the school wear?
The data show the numbers of pencils students in Mrs. Johnson's class each have in their backpacks.
0, 0, 2, 3, 1, 5, 2, 4, 6, 3, 3, 4, 7
Create a histogram to represent the data from Mrs. Johnson's class.

The data shown represents the number of laps each of 10 students ran around the track during gym class.
8, 10, 7, 7, 10, 8, 9, 10, 10, 7
Complete the line plot by drawing the two missing data points.

4x+9y=28
-4x-y=-28
-5x + 5y = -5
x - 5y = -7
(3, 2)
(-1, 3)
Infinite solutions
No solutions
What is the x-value for the solution to the following system of equations?
−x+y=5
-1
6
1
-6


5c + 10d = 16.50
5c + 10d = 14.25
5c + 10d = 16.50
5c + 10d = 16.50

Is (0,0) a solution to the system?
Solution
Not a solution
Is (-2, 0) a solution to the system?
Solution
Not a solution

Which point is a solution to the system of inequalities?
(-8,2)
(-2,-5)
(0,6)
(4, 3)


What is the inequality symbol for the equation of this boundary line?
less than
less than or equal to
greater than
greater than or equal to

y < 3
y > 3
y < 3
y > 3
Luka and Dana are making cookies for the Westland Pantry. They only have up to 6 hours to bake! They can bake 32 chocolate chip cookies in an hour (x), and 20 snickerdoodle cookies in an hour (y). They need to make at least 150 cookies. Which inequalities represent the situation?
x + y ≥ 6
32x + 20y ≤ 150
x + y ≥ 632
x + 20y ≥ 150
x + y ≤ 6
32x + 20y ≤ 150
x + y ≤ 6
32x + 20y ≥ 150
What's the difference between systems of equations and systems of inequalities?
Systems of equations have 1 solution, no solution, or infinite solutions while systems of inequalities can have a range of solutions.
Systems of equations use slope-intercept form only while systems of inequalities use standard form only.
Systems of equations have a shaded region while systems of inequalities do not.
There is no difference.
3x - 6y > 12

When you graph an inequality, you use a solid line when you use which symbols?
≤, ≥
<, >
When graphing an inequality, you use a dotted line when you use which symbol?
<, >
≤, ≥

What is the shape of the Data Set?
Skewed Left
Symmetrical
Skewed Right

What is the shape of the Data Set?
Skewed Left
Symmetrical
Skewed Right

What is the shape of the Data Set?
Skewed Left
Symmetrical
Skewed Right

Describe the shape of the graph.
Symmetrical
Skewed
Uniform

How would you describe this data?
Skewed Left
Skewed Right
Symmetrical
A total amount


Choose the best description of the overall shape of the dot plot.
Skewed
Uniform
Symmetrical

True or false, the data is skewed.
True
False

How would you describe this data?
Symmetrical
Skewed Left
Skewed Right
Tails

Describe the shape of distribution.
Symmetrical - U shaped/bimodel
Symmetrical - bell shaped
Skewed right
Skewed left

Describe the shape of distribution
Skewed right
Symmetrical - bell shaped
Skewed left
Symmetrical - U shaped/bimodel

Describe the shape of distribution
Bimodal
Symmetrical
Skewed Right
Skewed Left

Describe the shape of distribution
Bimodal
Symmetrical
Skewed Right
Skewed Left

Describe the shape of distribution
Bimodal
Symmetrical
Skewed Right
Skewed Left

Describe the shape of distribution
Bimodal
Symmetrical
Skewed Right
Skewed Left

Describe the shape of distribution
Uniform
Bell Shaped
Skewed Right
Skewed Left

Describe the shape of distribution
Uniform
Bell Shaped
Skewed Right
Skewed Left

Identify any outliers and clusters
cluster at 8
Clusters at 5 and 11
Outlier at 8
No outliers or clusters

Identify any outliers and clusters
Cluster at 5
Outlier at 10
Clustered near 4 and 6
Outlier at 10
Cluster at 6
No outliers or clusters

Identify any outliers and clusters
Cluster 7
Clustered near the 70s
78 is an Outlier
No outliers or clusters

Identify any outliers and clusters
Clustered around 22
Clustered at 25
28 is an Outlier
No outliers or clusters

Identify any outliers and clusters
Clustered around 13 and 16
Clustered at 15
13 is an Outlier
No outliers or clusters

Identify any outliers and clusters
Clustered around 0
Clustered around 1
7 is an Outlier
No outliers or clusters

Identify any outliers and clusters
Clustered around 6
Clustered around 51
51 is an Outlier
No outliers or clusters

Which descriptor is most accurate?
Clustered around 15
Clustered around 10
10 is an Outlier
No outliers or clusters

