
 Worksheets
ACID-BASE TITRATION CURVES
Total questions: 27
Worksheet time: 7hrs 45mins

A 50.0 mL sample of an acid, HA, of unknown molarity is titrated, and the pH of the resulting solution is measured with a pH meter and graphed as a function of the volume of 0.100 M NaOH added.
At point R in the titration, which of the following species has the highest concentration?
HA
A-
H3O+
OH-

A solution of a weak monoprotic acid is titrated with a solution of a strong base, KOH. Consider the points labeled (A) through (E) on the titration curve
that results, as shown below.
The point at which the concentrations of the weak acid and its conjugate base are approximately equal is
A
B
C
D
E
When a strong acid is titrated with a strong base using phenolphthalein as an indicator, the color changes abruptly at the endpoint of the titration and can be switched back and forth by the addition of only one drop of acid or base. The reason for the abruptness of this color change is that
a large change in pH occurs near the endpoint of the titration
a buffer solution exists at the endpoint of the titration
phenolphthalein is a strong proton donor
the pH of water is very resistant to change
phenolphthalein is much more sensitive to the pH of a solution than most other indicators

A student performs an acid-base titration and plots the experimental results in the graph above. Which of the following statements best explains the experimental findings?
A strong acid was titrated with a strong base, as evidenced by the equivalence point at pH = 7.
A strong acid was titrated with a strong base, as evidenced by the equivalence point at pH > 7.
A weak acid was titrated with a strong base, as evidenced by the equivalence point at pH > 7.
A weak acid was titrated with a weak base, as evidenced by the equivalence point at pH approximately 7.

NaOH(aq) + HCl(aq) → NaCl(aq) + H2O(l)
To determine the concentration of a NaOH(aq) solution, a student titrated a 50. mL sample with 0.10 M HCl(aq) . The reaction is represented by the equation above. The titration is monitored using a pH meter, and the experimental results are plotted in the graph below.
At the point labeled R on the pH curve, which of the following ions are present in the reaction mixture at a concentration greater than 0.01 M?
Na+ and Cl- only
Na+, Cl-, and H+ only
Na+, Cl-, and OH- only
Na+, Cl-, H+, and OH-
NaOH(aq) + HCl(aq) → NaCl(aq) + H2O(l)
To determine the concentration of a NaOH(aq) solution, a student titrated a 50. mL sample with 0.10 M HCl(aq) . The reaction is represented by the equation above. The titration is monitored using a pH meter, and the experimental results are plotted in the graph below.
One student titrated the NaOH(aq) with 1.0 M HCl(aq) instead of 0.10 M HCl(aq) . How would the student’s titration curve differ from the original curve?
The initial pH would be 11 instead of 13.
The pH at the equivalence point would be 5 instead of 7.
The pH far beyond the equivalence point would be higher than in the original curve.
The pH far beyond the equivalence point would be lower than in the original curve.
A 50.0 mL sample of an acid, HA, of unknown molarity is titrated, and the pH of the resulting solution is measured with a pH meter and graphed as a function of the volume of 0.100 M NaOH added.
A student carries out the same titration, but uses an indicator instead of a pH meter. If the indicator changes color slightly past the equivalence point, what will the student obtain for the calculated concentration of the acid?
Slightly less than 0.0800 M
Slightly more than 0.0800 M
Slightly less than 0.125 M
Slightly more than 0.125 M

The pH of solutions of four acids prepared at various concentrations were measured and recorded in the table above.
The four acids are, in no particular order, chlorous, hydrochloric, lactic, and propanoic.
If equal volumes of the four acids at a concentration of 0.50 M are each titrated with a strong base, which will require the greatest volume of base to reach the equivalence point?
Acid 1
Acid 2
Acid 3
Acid 4
All the acids will require the same volume of base to reach the equivalence point.
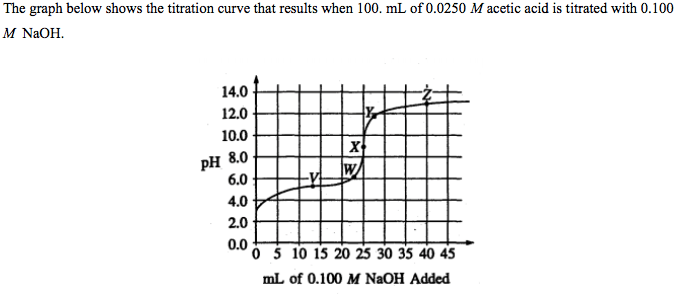
What part of the curve corresponds to the optimum buffer action for the acetic acid/acetate ion pair?
Point V
Point Z
Along all of section WY
Along all of section YZ
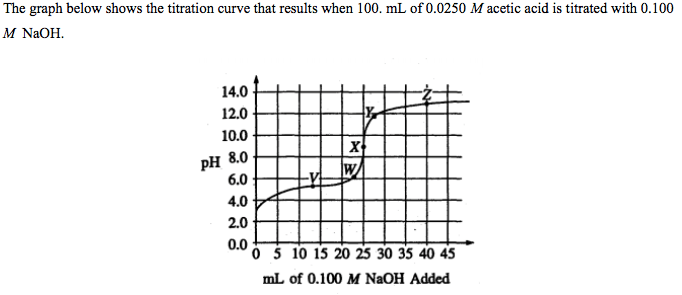
Which of the following indicators is the best choice for this titration?
Methyl orange (pH range of color change is 3.2 - 4.4)
Methyl red (pH range of color change is 4.8 - 6.0)
Bromothymol blue (pH range of color change is 6.1 - 7.6)
Phenolphthalein (pH range of color change is 8.2 - 10.0)
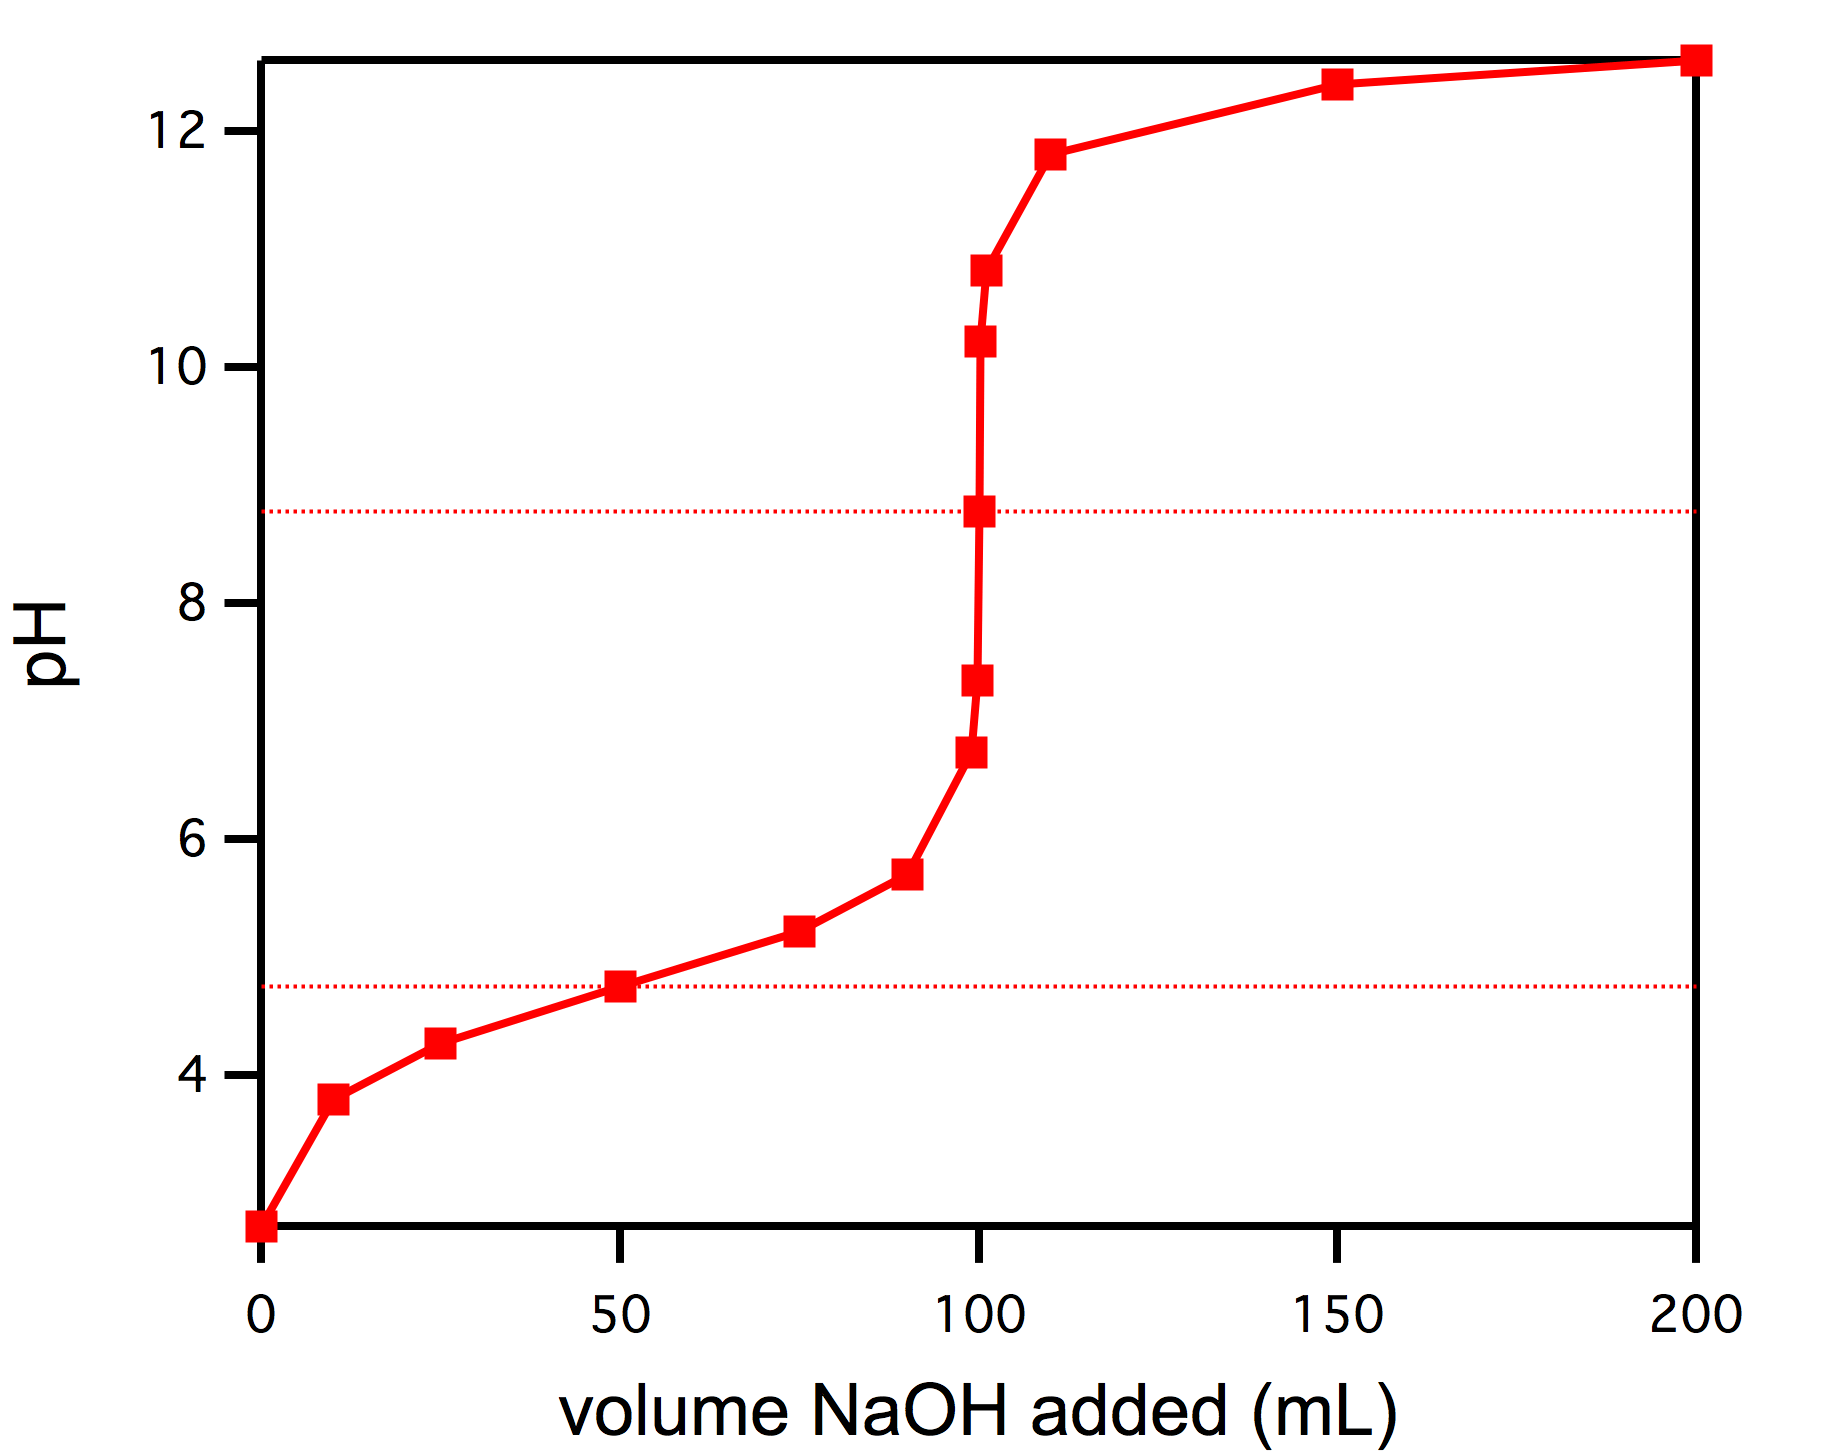
What is the pH at the equivalence point.
The pH is approximately 5
The pH is approximately 6
The pH is approximately 8
The pH is approximately 9
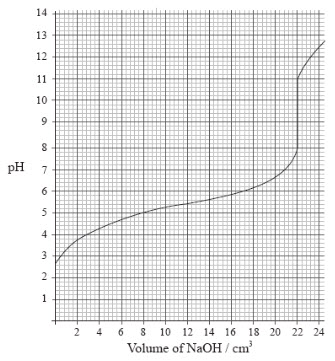
CH3COOH is titrated with NaOH. Name the salt produced and its pH at the equivalence point.
CH3COONa, pH at 5
CH3COONa, pH at 7
CH3COONa, pH at 9
NaCH3COO, pH at 9

The pH of the solution when the buffer solution in the flask contains equal concentrations of weak acid and conjugate base is
2.86
4.75
8.77
12.01


If a 40 mL solution of HCl required only 10 mL of NaOH titrant to reach the equivalence point, the relative molar concentration ratio (base:acid) is
1/4
1
1:1
4

what volume of alkali was needed to completely neutralize the acid
(a)

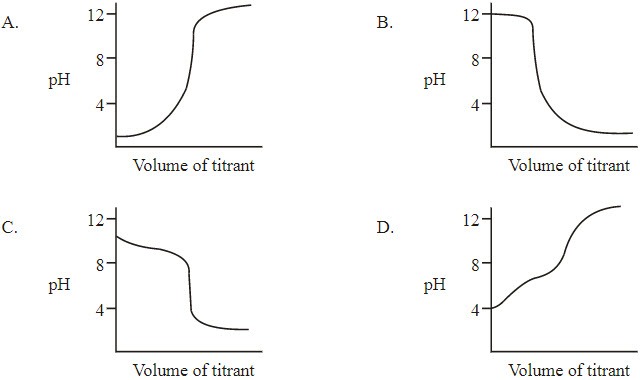
Which curve is produced by the dropping a strong alkali gradually into a flask of weak acid?
A
B
C
D
Which curve is produced by the dropping a strong acid gradually into a flask of weak base?
A
B
C
D

