
 Worksheets
Ecological Relationships w/ Graphs
Total questions: 27
Worksheet time: 15mins

Lichens are close associations of fungi and algae. The fungi hold the water supply and the algae perform photosynthesis to manufacture carbohydrates for both organisms.
mutualism
commensalism
parasitism

In the jungles of South America lives a thorn tree call an acacia. A species of ant eats secretions of the acacia, drinks its sap, and raises its young in the hollow thorns. The ants also keep competing vines from growing near the acacia tree and they help repel any insects that would damage the acacia tree.
mutualism
commensalism
parasitism

Lactobacilli are a type of bacteria that live in our lungs and destroy many of the microorganisms that enter our respiratory system. They are highly adapted to living in our lungs and can't survive in many other habitats.
mutualism
commensalism
parasitism
_______ occurs when two organisms are trying to acquire or get the same resources.
Symbiosis
Competition
Predation
Collaboration

According to the graph, what is causing the deer population to decrease
They got sick
The wolf population is decreasing
The wolf population increased
They ran out of food

Predator population lags behind prey population because......
Increase in predators leads to decrease in prey
Increase in predators leads to increase in prey
Increase in predators leads to decrease in producers
Increase in producers leads to increase in prey

The largest number of individuals that an environment can support long term is...
carrying capacity
emigration
immigration
population density

What happens if a population grows past its carrying capacity?
The population keeps growing
The population starts to die off
The entire species will go extinct
The carrying capacity just increases

What is the carrying capacity of the graph?
1000
8000
800
600
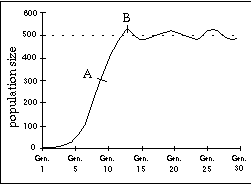
What is the carrying capacity of the graph?
around 500
more than 800
less than 300
around 700
A scientist was studying a population of fish in a pond over a period of 10 years. He observed that the population increased each year for 3 years, and then remained nearly constant for the rest of the study. The best explanation for this observation is that the population had
stopped reproducing
reached carrying capacity
mutated into a different species
run out of food and all died
When one organism eats another organism.
Competition
Parasitism
Commensalism
Predation
Mutualism
When two organisms fight for the same resource
Competition
Parasitism
Commensalism
Predation
Mutualism
When one organism benefits while the other organism is neither helped or hurt.
Competition
Parasitism
Commensalism
Predation
Mutualism
When one organism benefits while the other organism is hurt.
Competition
Parasitism
Commensalism
Predation
Mutualism

What is the relationship shown?
Predation
Commensalism
Competition
Parasitism
Mutualism

What is the relationship shown?
Predation
Commensalism
Competition
Parasitism
Mutualism

What is the relationship shown?
Predation
Commensalism
Competition
Parasitism
Mutualism

What is the relationship shown?
Predation
Commensalism
Competition
Parasitism
Mutualism

What is the relationship shown?
Predation
Commensalism
Competition
Parasitism
Mutualism

What is the relationship shown?
Predation
Commensalism
Competition
Parasitism
Mutualism

What is the relationship shown?
Predation
Commensalism
Competition
Parasitism
Mutualism

What is the relationship shown?
Predation
Commensalism
Competition
Parasitism
Mutualism

What is the relationship shown?
Predation
Commensalism
Competition
Parasitism
Mutualism

What is the relationship shown?
Predation
Commensalism
Competition
Parasitism
Mutualism

