
 Worksheets
Question Bank for Grade 9 Mathematics
Total questions: 157
Worksheet time: 6hrs 27mins

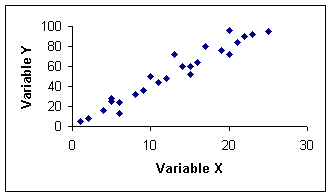
What type of association (correlation) does this graph have? (a)


True or False: Causation can be determined if a very strong correlation coefficient (r) is found.
True
False
A correlation shows that two things
Are Related
Cause Each Other to Happen
Are Unrelated
Correlation or Causation?
The speed you drive and the amount of fuel you use
Correlation
Causation
Correlation or Causation?
The inches of snowfall and the number of heart attacks
Correlation
Causation
The situation has correlation. Does it represent causation or just correlation?
The number of cars traveling over a busy holiday weekend and the number of accidents reported.
Correlation
Causation



What is the y-intercept?
-2
3
2
-3

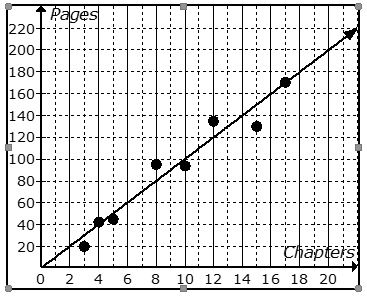
Is this line an accurate line estimate of best fit for the data?
Yes
No

What is the equation of the line of best fit?
y= −21x + 6
y= 21x +6
y= 6x + 2
y = -2x +6

Is this line an accurate line estimate of best fit for the data?
Yes
No

What is the equation of the line of best fit
y= -2x + 10
y= 10x+ 2
y= 10

What are the coordinates of the outlier?
(1,9)
(9,1)
(2,2)
y=x


Which scatter plot shows a linear relationship between x and y?
Graph A
Graph B
Graph C
Graph D


1
2
3
4

A
B
C

A
B
C
D

3. A 4. B
3. A 4. A
3. B 4. B
3. B 4. A


What was the relative percent of just 11th graders who liked SqaureBob SpongePants?
6%
5%
2%
10%

What percent of all students were females who prefer football?
16%
80%
8%
12%

This table shows the number of female and male students in each science class. How many students are taking biology?
18
8
80
26

Of the times when the forecast called for rain, what is the percentage that it actually rained?
About 90%
About 50%
About 70%
About 80%


What number should go in the blue box?
21
135
19
22

How many total people were surveyed?
78
22
70
100


What would you divide to find the relative frequencies by column? (Select all that apply.)
55/118
55/143
88/103
88/143
What would you divide to find the relative frequencies by row? (Select all that apply.)
55/118
55/143
88/103
88/143
Rows are __________, columns are _______.
horizontal, linear
horizontal, vertical
vertical, horizontal
vertical, linear

What percent of female athletes surveyed play basketball?
16%
52%
23%
31%

What percent of basketball players are female?
16%
52%
31%
36%

How many athletes were surveyed in all?
50
150
100
200
This table shows the number of female and male students in each science class. How many students are taking biology?
18
8
80
26

How many female students are taking physics?
14
19
33
24

How many male students were surveyed?
23
47
80
33


The number of times a data value occurs is called the __________________________.
attribute
data
statistical question
frequency

This is a
dot plot
frequency table
relative frequency table
histogram



True or False? Over 50% of the students watch between 5 and 14 hours of television on the weekend?
TRUE
FALSE

Uniform, with a spread of 89 years
Skewed, with a spread of 45 years
Uniform, with a spread of 14 years
Skewed, with a spread of 89 years

How many days did Ginger practice for more than a half hour?
2 days
7 days
9 days
5 days

the total number of pets owned by students in Mrs. Raabe's class is-
Greater than 45, but fewer than 50
Greater than 5, but fewer than 10
Greater than 30, but fewer than 35
greater than 50, but fewer than 55

Which word best describes the shape of the distribution?
Skewed
Symmetric
Uniform

How many books did the students read over the summer?
20
55
30
50

Based on the shape of the data distribution, what statement is true about the measure of the center?
The mean and median are equivalent
The mean is greater than the median
The mean is less than the median
None of these




What is the shape of the Data Set?
Skewed Left
Symmetrical
Skewed Right

What is the shape of the Data Set?
Skewed Left
Symmetrical
Skewed Right

What is the shape of the Data Set?
Skewed Left
Symmetrical
Skewed Right

The outside temperature and the amount of layers you wear.


The temperature outside and the amount of ice cream sales.
correlation measures _______________ among variables.
Direction of relationship
intensity of relationship
direction & intensity of relationship
Cause & effect relationship
The value of simple correlation coefficient lies between
0 and +1
0 and -1
+1 and -1
0 and 100

Estimate the correlation coefficient for this scatterplot.
A) r = 1.2
B) r = 0.89
C)r = 0
D) r = -0.89

Estimate the correlation coefficient for this scatterplot.
A) r = -0.9
B) r = 1
C) r = 0.9
D) r = -1

Estimate the correlation coefficient.
r is close to zero
r is close to -1
r is close to 1
r is close to -1.5
r is close to 1.5
Which example shows CAUSATION? (Which one CAUSED the other to happen.)
Being happy and being a better student.
An insect ate poison and it died.
Data is analyzed comparing hours studied and grades. It is determined that the correlation coefficient is 0.92. What does this mean?
There is a strong positive correlation between studying and grades.
There is a strong negative correlation between studying and grades.
There is a weak positive correlation between studying and grades.
There is a weak negative correlation between studying and grades.

If one factor is responsible for change in another factor then it means there is causation.
True or False
True
False
Which one is a TRUE statement?
Correlation means two phenomena are related
Correlation indicates the occurrence of causation
Causation only occurs when correlation is positive
All of the above
Carbon dioxide levels in the atmosphere are increasing. Fossil fuel use is increasing. Knowing just these two facts and NO OTHER INFORMATION, what is this?
Both
Causation
Correlation
Which one of these examples is NOT an example of CAUSATION?
Kryptonite causes Superman to lose all his powers.
Temperatures of less than 32˚F cause water to freeze.
Umbrellas cause rainstorms.
Stepping on the gas pedal causes a car to move faster.
Correlation or Causation: the number of bus stops increases, the number of car sales decreases?
Correlation
Causation
The height of a graduation cap in the air after it is thrown can be modeled by the function
y = -16t2 + 16t + 4
where t is time in seconds, and y is the height of the cap in feet.
Complete the square to find the maximum height of the cap in feet.

y = ____x + 6
4(2x-5)=7(2x+4)
4x+2y=16


x² - 121


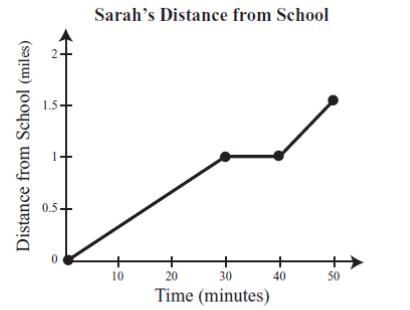
What is happening in the graph between 30 and 40 minutes?
Sarah is accelerating
Sarah is not moving
Sarah is slowing down
Sarah is travelling at a constant speed

Of the students who cannot bike to school, what percent of them are boys?
4%
14%
13%
29%

What percentage of girls have blonde hair?
30%
32%
29%
40%

What percentage of SUV's are driven by women?
56.25%
75%
83.25%
86.5%

What percentage of males drive sports cars?
35%
16.25%
65%
25%

What percentage of the boys had red hair?
5%
10%
12%
4%

Which scatter plot represents a positive correlation?
A
B
C
D


