
 Worksheets
Semester 2 - Battle Royale
Total questions: 100
Worksheet time: 5hrs 21mins
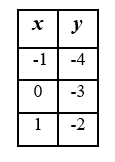
Which graph represents the table?
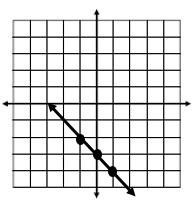
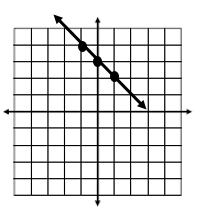
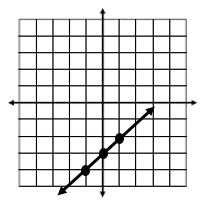
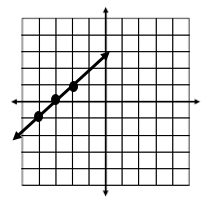
Which graph represents the equation y=4x−1
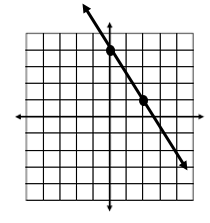
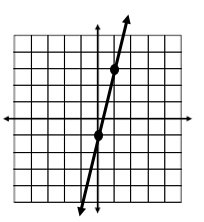
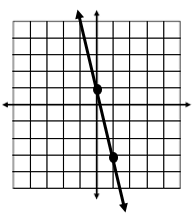
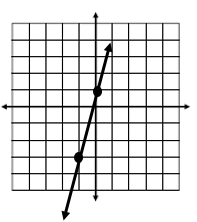

Which graph represents the table?


What is 'b' in this linear equation? y= 5x - 6
6
5
y
-6
What direction is the line if the slope is positive?
descending
ascending
What's the slope of the function y=2/3x+6
2/3
3/2
6
-4
(-1,-9) and (5, -6)
(-4, 3) and (-4, -7)
(8,5) and (-9, 5)

What is the equation of a line with slope of 4 and y-intercept of -3?
y = -3x + 4
y = 3x - 4
y = 4x + 3
y = 4x - 3
What is the equation of the line with a y-intercept of 1/2 and slope of -3?
y=1/2x - 3
y=-3x + 1/2
y= 3x - 1/2
y=-1/2x + 3

What appears to be the equation of th line in the graph above?
y = x + 4
y = -4/3x + 4
y = 4/3x + 4
y = 2x - 3

x = -1
y = -1
y = -1x
y = x - 1
2x + y = 6
(0, 3) and (6, 0)
(0, -3) and (-6, 0)
(3, 0) and (0, 6)
(-3, 0) and (0, -6)
3x + 8y = 24
(8, 0)
(0, 8)
(3, 0)
(0, 3)

y = 3
y = 3x
x = 3
x = 3y
Which of these represents standard form?
y - y1 = m(x-x1)
Ax + By = C
y = mx + b
What type of line is the equation x = 8 ?
vertical
horizontal
neither
What type of line is the equation y = 10 ?
vertical
horizontal
neither
What type of line has a slope of 0?
vertical
horizontal
neither
What type of line has an undefined slope?
vertical
horizontal
neither
What is the equation of the horizontal line that goes through the point (6, 7) ?
x = 6
x = 7
y = 6
y = 7
What is the equation of the line in the graph?
x = −1
y = −1
y = −1x
y = x − 1


3x3 +8x
x3+3x2 +8x
2x2 +8x
x3-3x3 +8x2

4g2-2g
4g2+4g-6
6g2+2g+6
4g2+2g

3y4+3y3+7y2+4y
3y4+3y3+7y2+4y+6
3y4+3y3+7y2+6
3y4+3y3+7y2+4y-6

3n2+4n
-3n2+4n
3n2+20n
3n2-4n

23x5_11x
-5x5-x
23x5+11x
5x5+x

4w2-11w
2w2-11w
2w2+11w
4w2+w

2x2-13x-7
2x2+13x+7
-2x2-13x-7
-2x2+13x-7

6x2-8x+4
4x2-16x+4
6x2-16x-4
4x2-8x+4

3x3+5x2+3x+15
3x3+6x2+3x+16
3x3+6x2+3x+15
2x3+5x2+2x+16

-10x2-9
10x2-9
-5x2-2x-6
-5x2-4x-9

x2+17x
5x2+7x
-5x2+17x
5x2+17x

4g2+2g
-4g2+2g
4g2-2g
4g2+2g+12

What is the experimental probability of tails?
65%
35%
100%
00%

What is the experimental probability of red?
1/3
1/5
7/15
1/30

If the spinner is spun 80 times, how many times would it land on yellow? (hint:set up a proportion)
10
20
30
40
4 white, 7 blue, and 8 yellow. You choose one counter at random. Which color are you least likely to choose?
A marble will be drawn from the bag and replaced 100 times. What is a reasonable prediction for the number of times a green or black marble will be drawn?
While standing outside of the school waiting to go home, you notice that 3 out of every 12 students leaving school are on their cell phones. What is the probability that the next student leaving school will NOT be on his or her cell phone?
25%
30%
75%
70%

Factor Completely:
2n2-8n3
2n2(n-4n2)
2n2(1-4n)
2n3(10-8n2)
3n(1-4n)
Factor Completely
x2 - 5x
1(x - 5)
x(x - 5x)
x(x - 5)
x2(1 - 5)
Factor Completely:
6m2 + 16m
2(3m2 + 8m)
2m(3m + 8)
2m(3m - 8m)
not factorable
Factor Completely
12x2y4 - 6xy
3xy (4xy3 - 2)
6xy (2xy3 - 1)
6xy (2x3y5 - x2y2)
6xy ( 2xy3)
4p³+8p²+3p+6


Determine the predicted income if 22 hours were worked on an assembly job.
$207.30
$449.60
$691.90
$543.30
This measures how strong or weak the relationship between 2 quantitative variables are.
Scatter Plot
Causation
Correlation
Line of best fit
What does the value, r= -0.89, tell us about the linear relationship of two quantitative variables?
Strong positive
Weak positive
Strong negative
Weak negative

Is this line an accurate line estimate of best fit for the data?
Yes
No

Is this line an accurate line estimate of best fit for the data?
Yes
No

What type of Correlation?
Positive Correlation
Negative Correlation
No Correlation
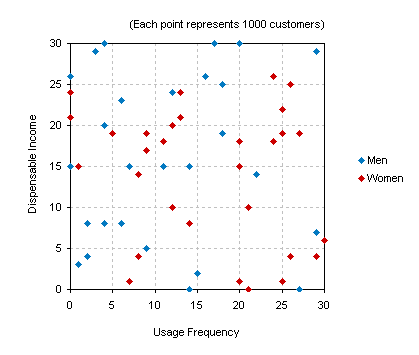
What type of Correlation?
Positive Correlation
Negative Correlation
No Correlation

If a linear regression had a correlation coefficient of -.9 what can we say about the quality of the model?
It is very reliable.
It cannot be used to estimate.
It is unreliable.
Which of the graphs represents the linear inequality y>21x+3 ?


Which of the graphs represents the linear inequality y≤−x−4 ?


Which of the following linear inequalities represents the graph?
y≥3
x≥3
y≤3
y<3

Which of the following linear inequalities represents the graph?
y≥3x
y>3x
y<3x
y>31x

Which of the following linear inequalities represents the graph?
y≥41x
y≤4x−2
y<41x+2
y≤41x+2

Which of the following linear inequalities represents the graph?
y>−54x−1
y≤54x+1
y<−54x−1
y≤−54x+1
When graphing a linear inequality, < and > signs would require you to draw...
a solid line
a dotted line
When graphing a linear inequality, ≤ and ≥ signs would require you to draw...
a solid line
a dotted line

5 ≥ x


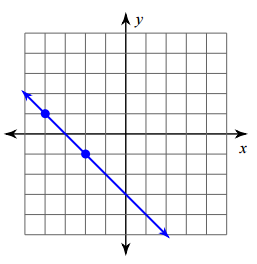
(6,7) and (4,2)
(2, 4) and (6, 12)
(10, 1) and (5, 2)

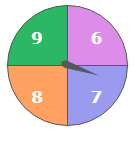
You spin the spinner 1 time.
What is P(7)?
1%
50%
20%
25%
You flip a coin.
What is P(heads)?
50%
1%
25%
100%
Cindy owns 7 t-shirts, 2 of which are gray. If Cindy randomly selects a t-shirt to wear, what is the probability it will be gray?
2/7
5/7
7/7
1/7

You pick a card at random.
What is P(5)?
3/1
3/4
1/4
1
You roll a 6-sided die.
What is P(3)?
1/6
1/3
3/6
6

You spin the spinner once.
What is P(3)?
8%
25%
36%
2%

A bag contains 5 quarters, 2 dimes, and 4 pennies. What is the probability of picking a quarter?
5/11
5/6
1/3
5
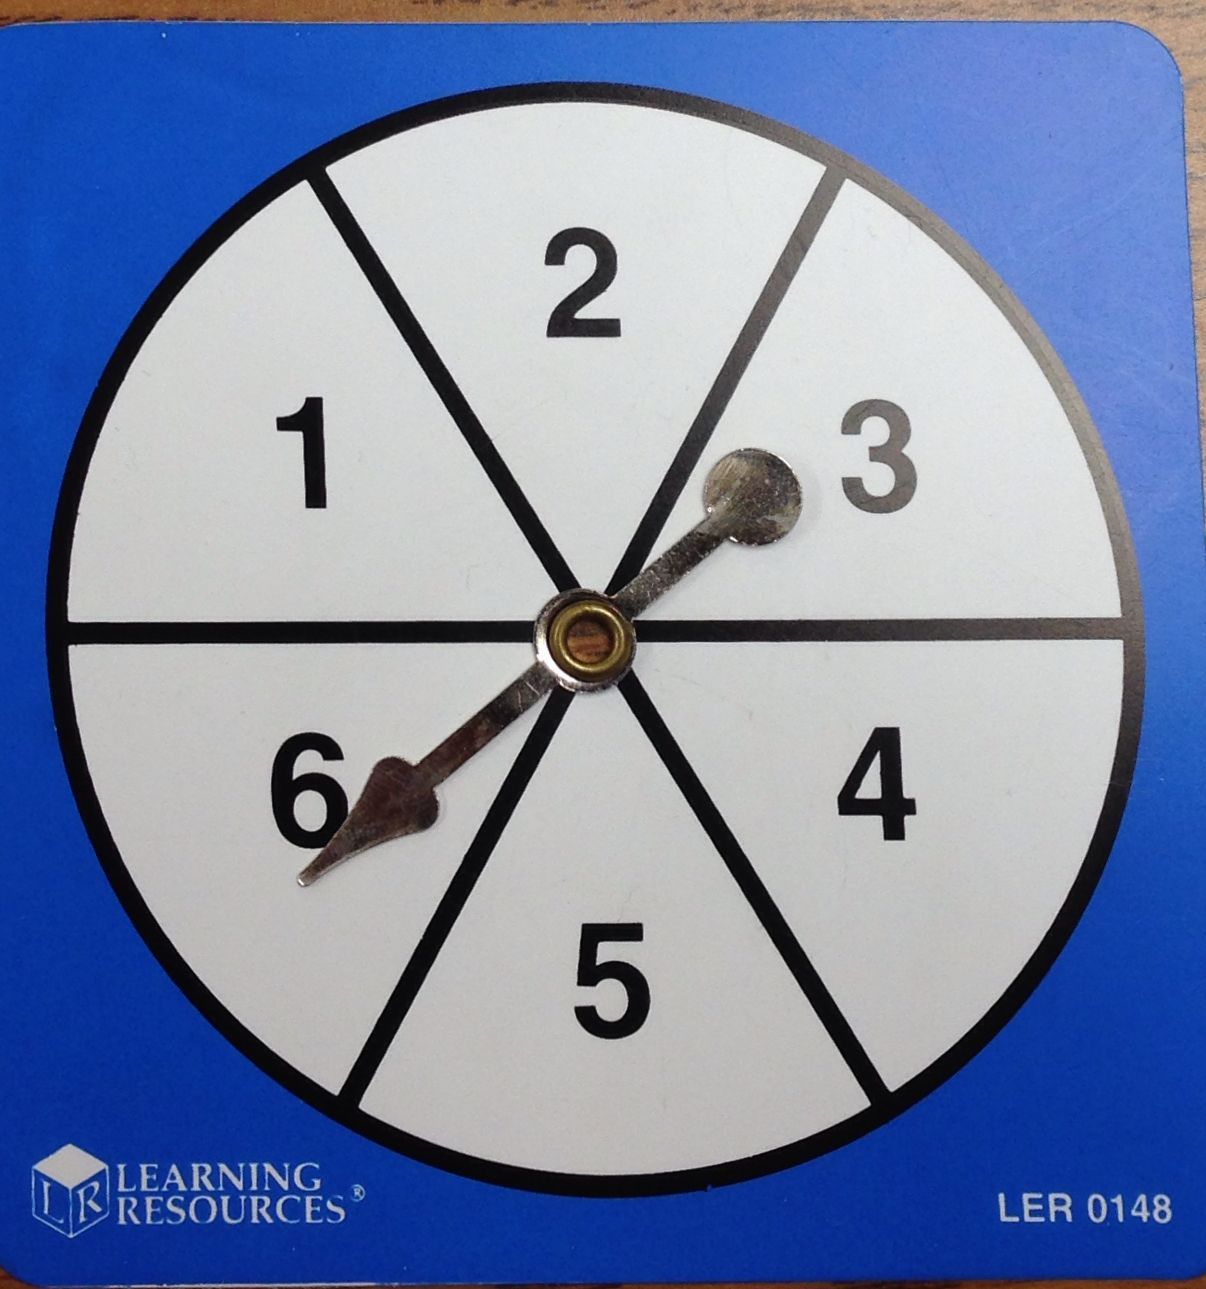
What is the probability of spinning an even number?
16 2/3%
33 1/3%
50%
75%

