
 Worksheets
Speed, Velocity & Acceleration
Total questions: 15
Worksheet time: 15mins
Two distance/ time graphs and two speed/ time graphs are shown.
Which graph represents an object that is at rest?


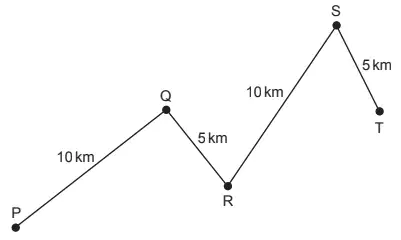
A car travels along the route PQRST in 30 minutes.
What is the average speed of the car?
10km/ hour
20km/ hour
30km/ hour
60km/ hour
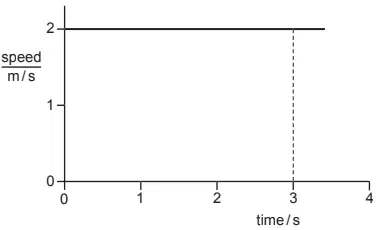
The diagram shows the speed/ time graph for an object moving at constant speed.
What is the distance travelled by the object in the first 3s?
1.5 m
2.0 m
3.0 m
6.0 m
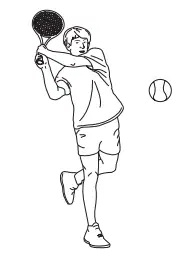
A tennis player hits a ball hard and 0.40s later hears the echo from a wall.
The speed of sound in air is 330m/ s.
How far away is the player from the wall?
66 m
132 m
264 m
825 m
An object moves initially with constant speed and then with constant acceleration.
Which graph shows this motion?


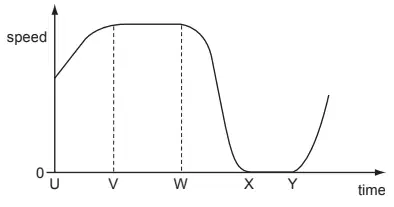
The graph shows how the speed of a car changes with time.
Between which two times is the car stationary?
U and V
V and W
W and X
X and Y

A child is standing on the platform of a station.
A train travelling at 30m/ s takes 3.0s to pass the child.
What is the length of the train?
10 m
27 m
30m
90 m
In a race, a car travels 60 times around a 3.6km track. This takes 2.4 hours.
What is the average speed of the car?
1.5 km/h
90 km/h
144 km/h
216 km/h

A car travels at various speeds during a short journey.
The table shows the distances travelled and the times taken during each of four stages P, Q, R and S.
During which two stages is the car travelling at the same average speed?
P and Q
P and S
Q and R
R and S
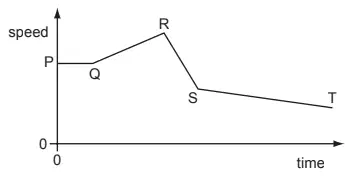
The diagram shows the speed/ time graph for a train as it travels along a track.
For which part of the graph is the train’s speed changing at the greatest rate?
PQ
QR
RS
ST
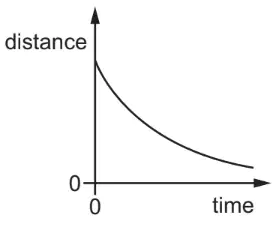
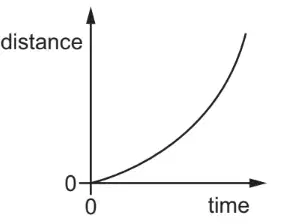
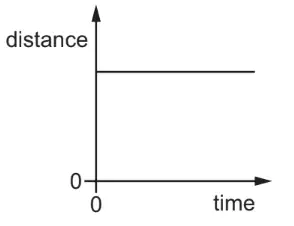
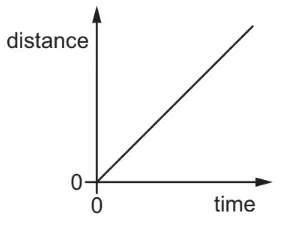
Which distance/time graph represents the motion of an object moving at constant speed?
A car takes 15 minutes to travel along a road that is 20 km long.
What is the average speed of the car?
0.75 km/h
5.0 km/h
80 km/h
300km/ h
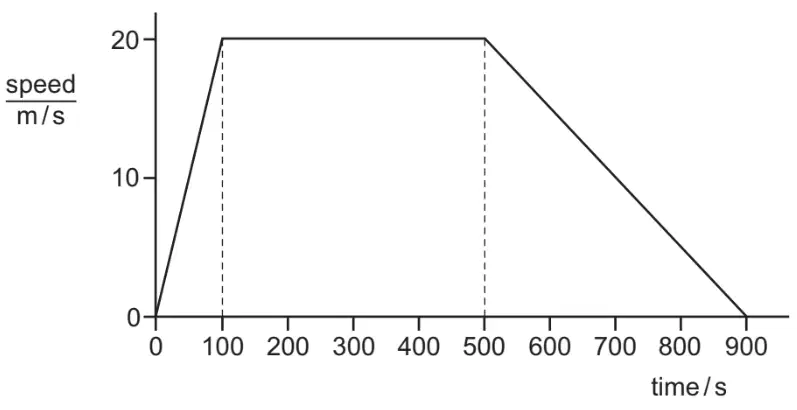
The graph represents the motion of a train travelling between two stations.
Which statement about the train is correct?
Its acceleration takes a longer time than its deceleration.
It travels at constant speed for less than half of its journey time.
It travels 2000m in the first 100s.
It travels 10000m at constant speed.
A car travels 6.0km along a main road in 6.0 minutes. It then travels 2.0km along a minor road in 6.0 minutes.
Which calculation of average speed for the whole journey is correct?
8.0 ÷ 12.0 = 0.67 km/minute
12.0 ÷ 8.0 = 1.5 km/minute
8.0 + 12.0 = 20 km/minute
8.0 × 12.0 = 96 km/minute
What does the area under a speed-time graph represent?
acceleration
average speed
deceleration
distance travelled

