
Font size
 Worksheets
Final Exam, Part I, Statistics
Total questions: 242
Worksheet time: 2hrs 3mins

What is the range of this graph?
What is the IQR of this graph?
What is the median of this graph?

What is the range of this graph?
What is the IQR of this graph?
What is the median of this graph?

What is the range of this graph?
What is the IQR of this graph?
What is the median of this graph?
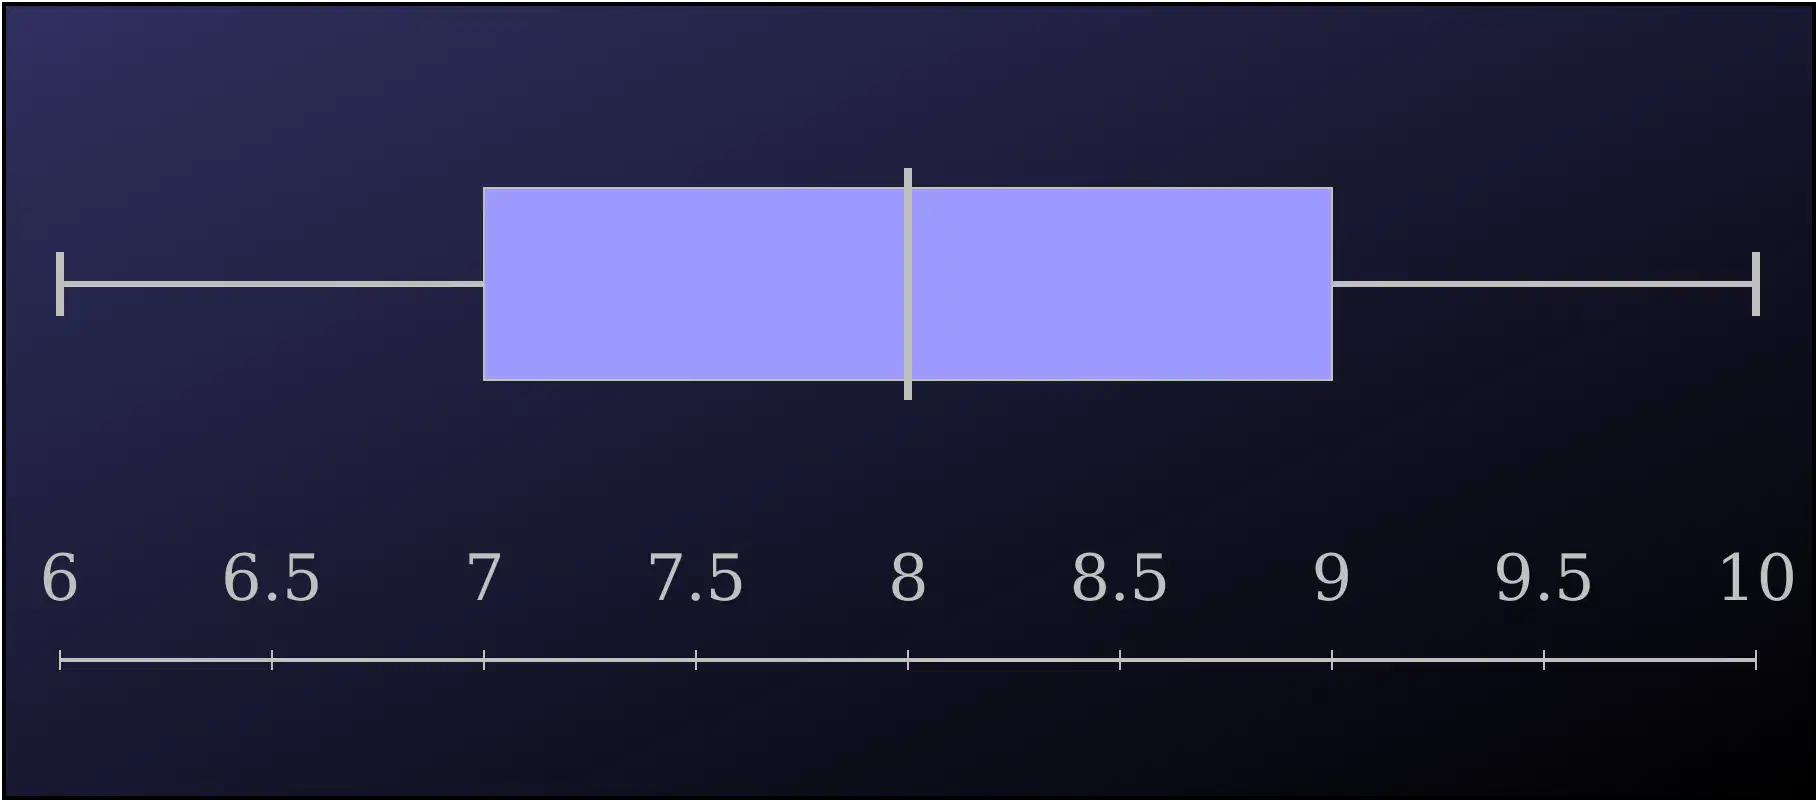
What is the range of this graph?
What is the IQR of this graph?
What is the median of this graph?

What is the range of this graph?
What is the IQR of this graph?
What is the median of this graph?

What is the range of this graph?
What is the IQR of this graph?
What is the median of this graph?

What is the range of this graph?
What is the IQR of this graph?
What is the median of this graph?

What is the range of this graph?
What is the IQR of this graph?
What is the median of this graph?

What is the range of this graph?
What is the IQR of this graph?
What is the median of this graph?

What percentage of data values are between
10 and 11?
25%
50%
75%
100%
What percentage of data values are between
10 and 13?
25%
50%
75%
100%
What percentage of data values are between
10 and 15?
25%
50%
75%
100%
What percentage of data values are between
10 and 18?
25%
50%
75%
100%
What percentage of data values are between
11 and 13?
25%
50%
75%
100%
What percentage of data values are between
11 and 15?
25%
50%
75%
100%
What percentage of data values are between
11 and 18?
25%
50%
75%
100%

What percentage of data values are between
1 and 3?
25%
50%
75%
100%
What percentage of data values are between
1 and 5?
25%
50%
75%
100%
What percentage of data values are between
1 and 7?
25%
50%
75%
100%
What percentage of data values are between
1 and 9?
25%
50%
75%
100%
What percentage of data values are between
3 and 5?
25%
50%
75%
100%
What percentage of data values are between
3 and 7?
25%
50%
75%
100%
What percentage of data values are between
3 and 9?
25%
50%
75%
100%
What percentage of data values are between
5 and 7?
25%
50%
75%
100%
What percentage of data values are between
5 and 9?
25%
50%
75%
100%
What percentage of data values are between
7 and 9?
25%
50%
75%
100%
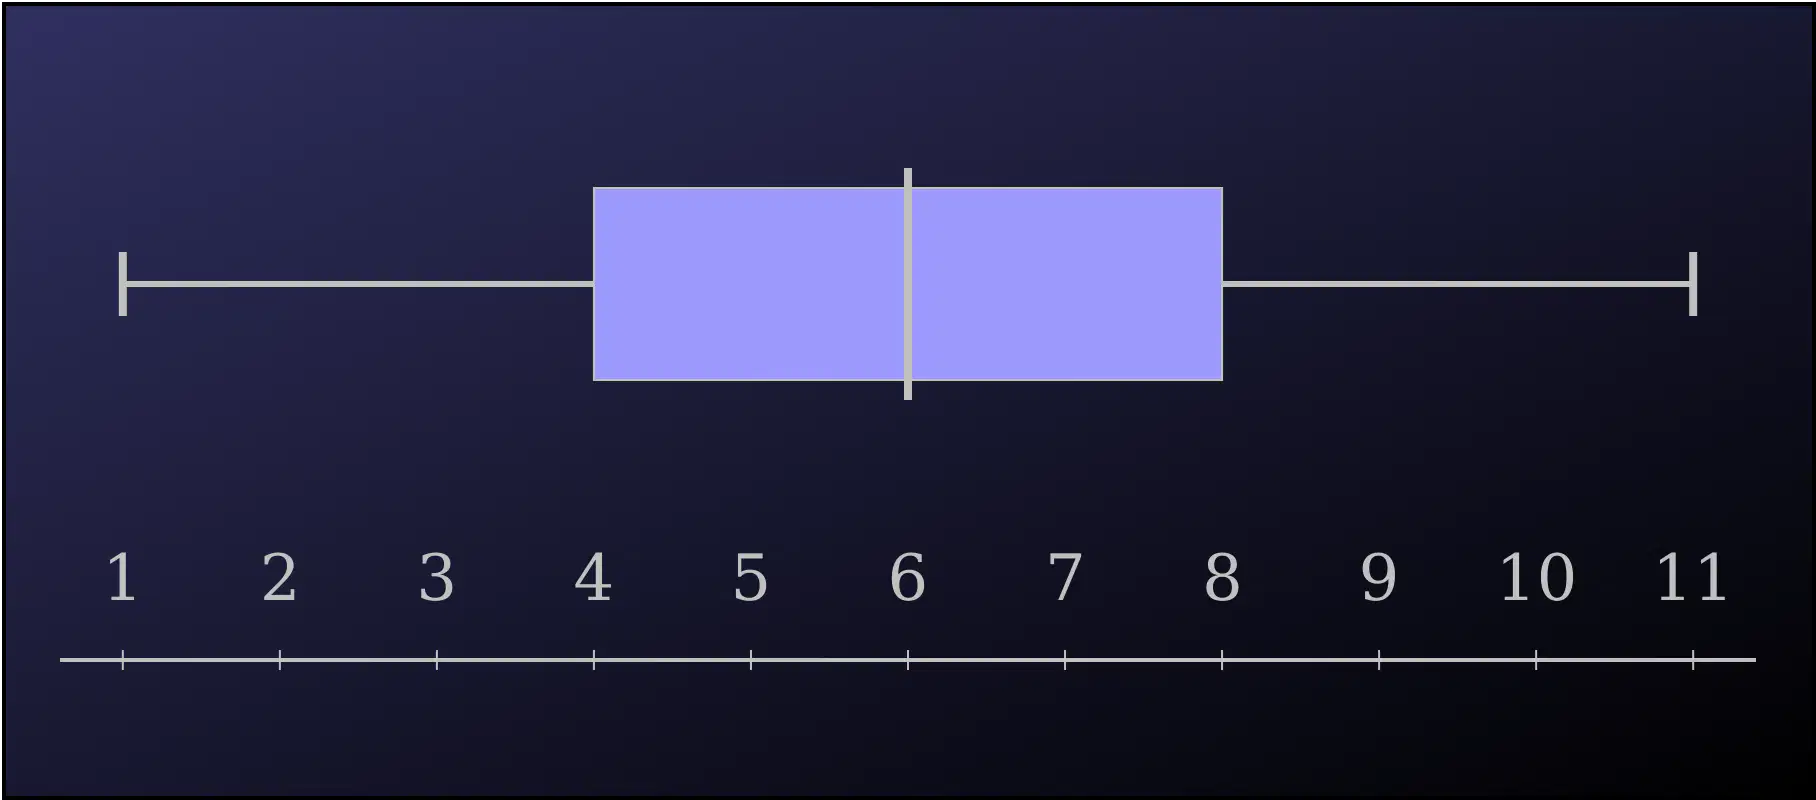
What percentage of data values are between
1 and 4?
25%
50%
75%
100%
What percentage of data values are between
1 and 6?
25%
50%
75%
100%
What percentage of data values are between
1 and 8?
25%
50%
75%
100%
What percentage of data values are between
1 and 11?
25%
50%
75%
100%
What percentage of data values are between
4 and 6?
25%
50%
75%
100%
What percentage of data values are between
4 and 8?
25%
50%
75%
100%
What percentage of data values are between
4 and 11?
25%
50%
75%
100%
What percentage of data values are between
6 and 8?
25%
50%
75%
100%
What percentage of data values are between
6 and 11?
25%
50%
75%
100%
What percentage of data values are between
8 and 11?
25%
50%
75%
100%

What percentage of data values are between
2 and 3?
25%
50%
75%
100%
What percentage of data values are between
2 and 5?
25%
50%
75%
100%
What percentage of data values are between
2 and 7?
25%
50%
75%
100%
What percentage of data values are between
2 and 8?
25%
50%
75%
100%
What percentage of data values are between
3 and 5?
25%
50%
75%
100%
What percentage of data values are between
3 and 7?
25%
50%
75%
100%
What percentage of data values are between
3 and 8?
25%
50%
75%
100%
What percentage of data values are between
5 and 7?
25%
50%
75%
100%
What percentage of data values are between
5 and 8?
25%
50%
75%
100%
What percentage of data values are between
7 and 8?
25%
50%
75%
100%
Click on the box where the minimum is shown?
Click on the box where Q1 is shown?
Click on the box where the median is shown?
Click on the box where Q3 is shown?
Click on the box where the maximum is shown?

What is the range of this graph?
(a)
What is the median of this graph?
(a)
Click on the minimum of this graph.
Click on the first quartile of this graph.
Click on the median of this graph.
Click on the third quartile of this graph.
Click on the maximum of this graph.
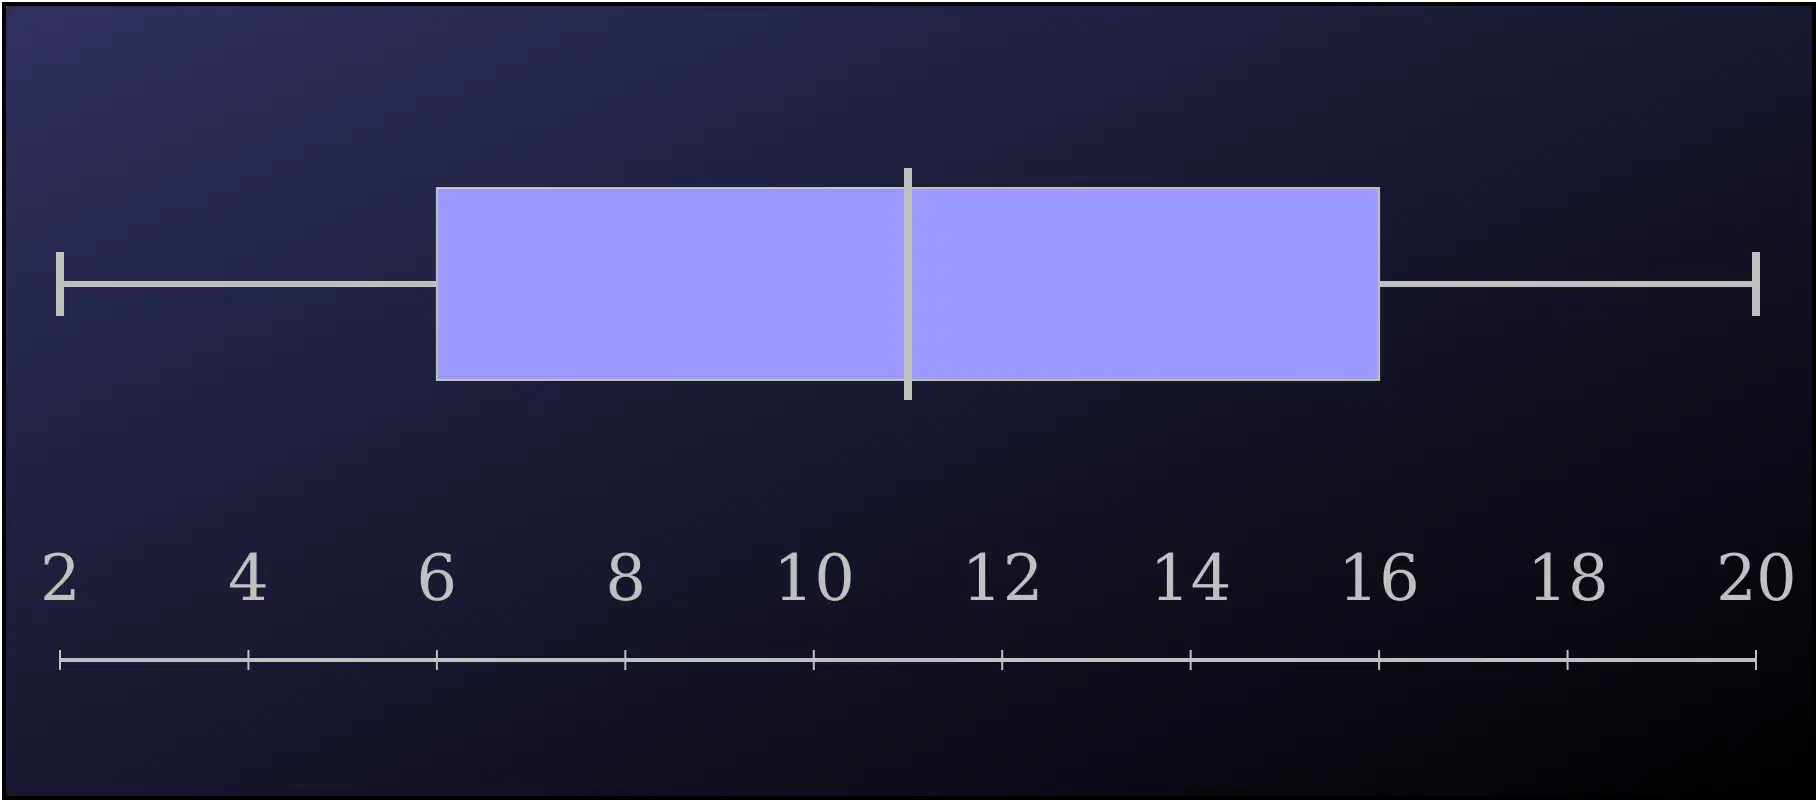
What is the range of this graph?
(a)
What is the IQR of this graph?
(a)
Which one of these graphs has...
Min=2


Which one of these graphs has...
Min=3
Which one of these graphs has...
Min=4
Which one of these graphs has...
Min=5
Which one of these graphs has...
Q1=4
Which one of these graphs has...
Q1=5
Which one of these graphs has...
Q1=6
Which one of these graphs has...
Q1=7
Which one of these graphs has...
Median=8
Which one of these graphs has...
Median=9
Which one of these graphs has...
Median=10
Which one of these graphs has...
Median=11
Which one of these graphs has...
Q3=12
Which one of these graphs has...
Q3=13
Which one of these graphs has...
Q3=14
Which one of these graphs has...
Q3=15
Which one of these graphs has...
Max=14
Which one of these graphs has...
Max=15
Which one of these graphs has...
Max=16
Which one of these graphs has...
Max=17

P(1 | A)=
P(2 | A)=
P(1 | B)=
P(2 | B)=

P(1 | A)=
P(2 | A)=
P(1 | B)=
P(2 | B)=
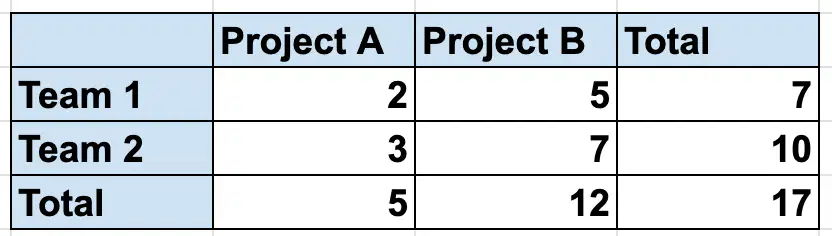
Which is true?
P(1|A)<P(2|A)
P(1|A)=P(2|A)
P(1|A)>P(2|A)
Which is true?
P(1|B)<P(2|B)
P(1|B)=P(2|B)
P(1|B)>P(2|B)

P(1 | A)=
P(2 | A)=
P(1 | B)=
P(2 | B)=
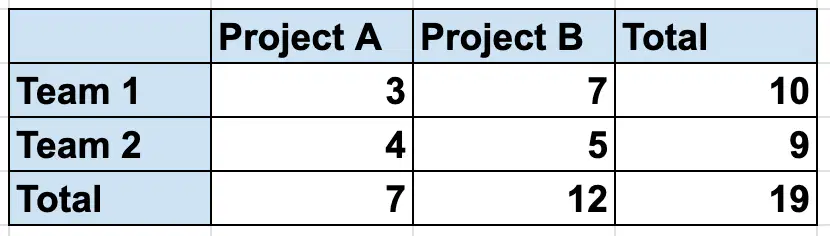
Which is true?
P(1|A)<P(2|A)
P(1|A)=P(2|A)
P(1|A)>P(2|A)
Which is true?
P(1|B)<P(2|B)
P(1|B)=P(2|B)
P(1|B)>P(2|B)
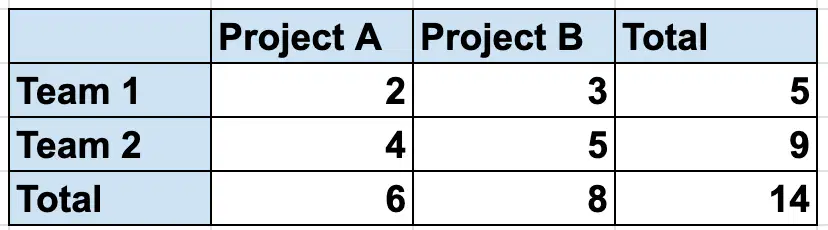
P(1 | A)=
P(2 | A)=
P(1 | B)=
P(2 | B)=
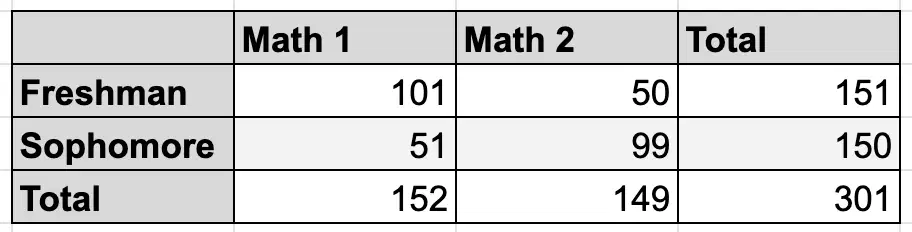
P(Math 1 | Freshman)=
P(Math 2 | Freshman)=
P(Math 1 | Sophomore)=
P(Math 2 | Sophomore)=

P(Math 1 | Freshman)=
P(Math 2 | Freshman)=
P(Math 1 | Sophomore)=
P(Math 2 | Sophomore)=
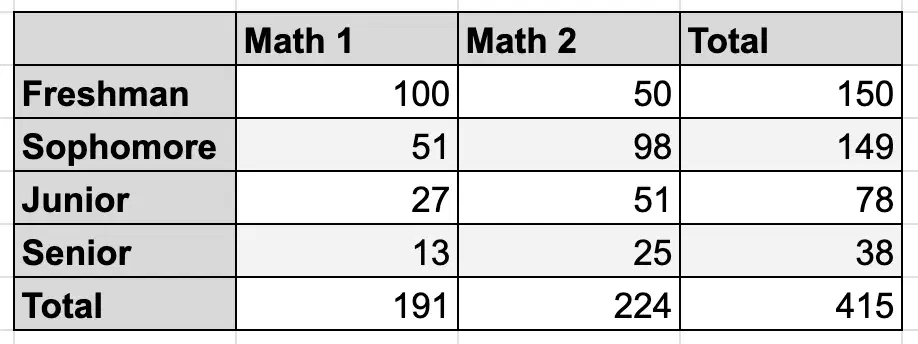
P(Math 1 | Freshmen)=
P(Math 2 | Freshmen)=
P(Math 1 | Sophomore)=
P(Math 2 | Sophomore)=
P(Math 1 | Junior)=
P(Math 2 | Junior)=
P(Math 1 | Senior)=
P(Math 2 | Senior)=

P(A | 1)=
P(B | 1)=
P(A | 2)=
P(B | 2)=
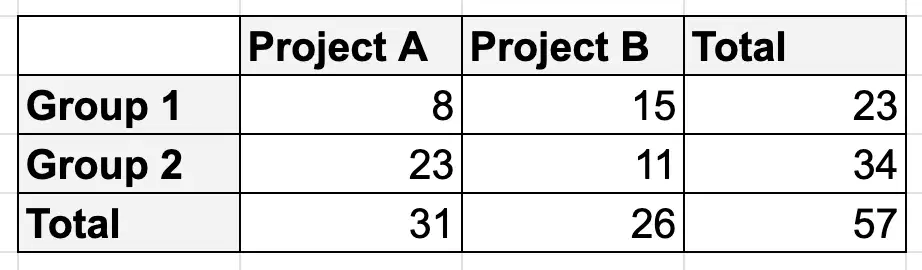
P(A | 1)=
P(B | 1)=
P(A | 2)=
P(B | 2)=

P(A | 1)=
P(B | 1)=
P(A | 2)=
P(B | 2)=
Which graph has a perfect positive correlation?


Which graph has a perfect negative correlation?
Which graph has a strong positive correlation?
Which graph has a strong negative correlation?
Which two graphs have a positive correlation?
Which two graphs have a negative correlation?
Which two graphs have a perfect correlation?
Which two graphs have a strong correlation?
Which graph has a strong positive correlation?


Which graph has a strong negative correlation?
Which graph has a weak positive correlation?
Which graph has a weak negative correlation?
Which two graphs have a strong correlation?
Which two graphs have a weak correlation?
Which two graphs have a positive correlation?
Which two graphs have a negative correlation?

This graph's correlation is...
Positive
Negative
Perfect
Strong

This graph's correlation is...
Positive
Negative
Perfect
Strong

This graph's correlation is...
Positive
Negative
Perfect
Strong

This graph's correlation is...
Positive
Negative
Perfect
Strong
For
A=(2, 3, 4)
B=(3, 3, 3)
Which is true?
Mean(A)=Mean(B)
Mean(A)>Mean(B)
Mean(A)<Mean(B)
For
A=(2, 3, 3)
B=(3, 3, 4)
Which is true?
Mean(A)=Mean(B)
Mean(A)>Mean(B)
Mean(A)<Mean(B)
For
A=(2, 3, 3)
B=(3, 3, 4)
Which is true?
Mode(A)=Mode(B)
Mode(A)>Mode(B)
Mode(A)<Mode(B)
For
A=(3, 3, 4, 4)
B=(3, 4)
Which is true?
Mean(A)=Mean(B)
Mean(A)>Mean(B)
Mean(A)<Mean(B)
For
A=(3, 3, 3, 4)
B=(3, 4)
Which is true?
Mean(A)=Mean(B)
Mean(A)>Mean(B)
Mean(A)<Mean(B)
For
A=(3, 4, 4, 4)
B=(3, 4)
Which is true?
Mean(A)=Mean(B)
Mean(A)>Mean(B)
Mean(A)<Mean(B)
For
A=(1, 2, 3, 4)
B=(1, 4)
Which is true?
Mean(A)=Mean(B)
Mean(A)>Mean(B)
Mean(A)<Mean(B)
For
A=(1, 2, 3, 4)
B=(1, 5)
Which is true?
Mean(A)=Mean(B)
Mean(A)>Mean(B)
Mean(A)<Mean(B)
For
A=(1, 2, 3, 4)
B=(1, 3)
Which is true?
Mean(A)=Mean(B)
Mean(A)>Mean(B)
Mean(A)<Mean(B)
For
A=(4, 4, 5, 5)
B=(4, 5)
Which is true?
Mean(A)=Mean(B)
Mean(A)>Mean(B)
Mean(A)<Mean(B)
For
A=(4, 4, 4, 5)
B=(4, 5)
Which is true?
Mean(A)=Mean(B)
Mean(A)>Mean(B)
Mean(A)<Mean(B)
For
A=(4, 5, 5, 5)
B=(4, 5)
Which is true?
Mean(A)=Mean(B)
Mean(A)>Mean(B)
Mean(A)<Mean(B)
For
A=(1, 3, 5)
B=(2, 3, 4)
Which is true?
Mean(A)=Mean(B)
Mean(A)>Mean(B)
Mean(A)<Mean(B)
For
A=(1, 3, 5)
B=(1, 3, 6)
Which is true?
Mean(A)=Mean(B)
Mean(A)>Mean(B)
Mean(A)<Mean(B)
For
A=(1, 3, 5)
B=(1, 3, 4)
Which is true?
Mean(A)=Mean(B)
Mean(A)>Mean(B)
Mean(A)<Mean(B)
For
A=(2, 2, 3)
B=(3, 3, 4)
Which is true?
Mode(A)=Mode(B)
Mode(A)>Mode(B)
Mode(A)<Mode(B)
For
A=(2, 3, 3)
B=(3, 4, 4)
Which is true?
Mode(A)=Mode(B)
Mode(A)>Mode(B)
Mode(A)<Mode(B)
For
A=(2, 3, 10)
B=(2, 3, 4)
Which is true?
Median(A)=Median(B)
Median(A)>Median(B)
Median(A)<Median(B)
For
A=(2, 3, 4, 5)
B=(2, 3, 4)
Which is true?
Median(A)=Median(B)
Median(A)>Median(B)
Median(A)<Median(B)
For
A=(2, 3, 4, 5)
B=(2, 3, 4)
Which is true?
Median(A)=Median(B)
Median(A)>Median(B)
Median(A)<Median(B)
For
A=(1, 2, 3, 4)
B=(2, 3, 4)
Which is true?
Median(A)=Median(B)
Median(A)>Median(B)
Median(A)<Median(B)
If the correlation coefficient is
r=−0.03
then what two things are true...
Generally the slope is positive.
Generally the slope is negative.
A linear model is a good fit for the data.
A linear model is a bad fit for the data.
If the correlation coefficient is
r=0.8
then what two things are true...
Generally the slope is positive.
Generally the slope is negative.
A linear model is a good fit for the data.
A linear model is a bad fit for the data.
What is lower quartile for this sequence?
a=(1, 3, 4, 6, 7, 9)
Q1=
3
4
6
7
What is the upper quartile for this sequence?
a=(1, 3, 4, 6, 7, 9)
Q3=
(a)
What is the interquartile range of this sequence?
a=(1, 3, 4, 6, 7, 9)
IQR=
(a)
What is the interquartile range of this sequence?
a=(1, 4, 7, 7, 10, 13)
IQR=
(a)
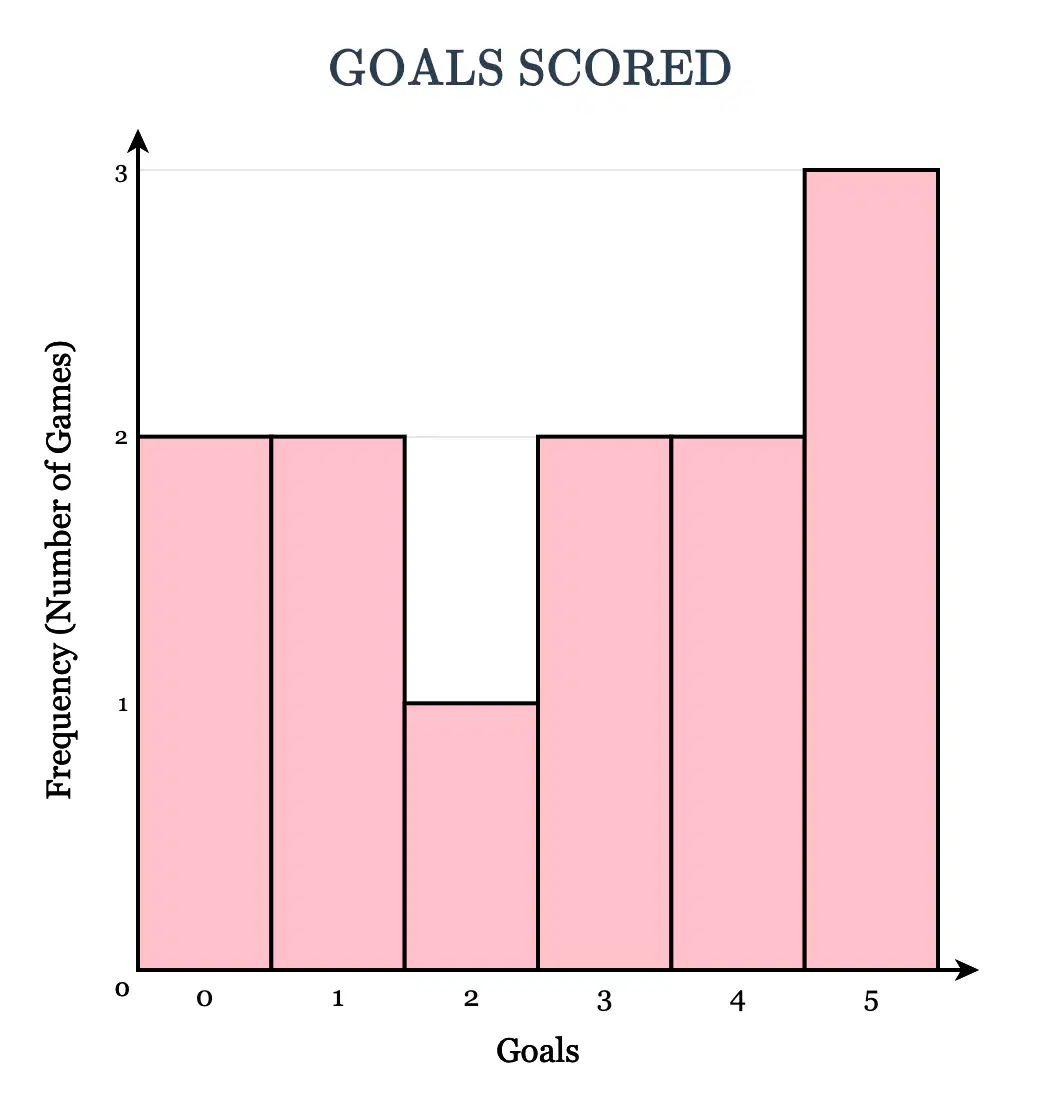
How many games had 2 goals scored?
(a)
How many games had 5 goals scored?
(a)
How many total games are represented in this graph?
(a)
For how many games was the score 2 or fewer?
(a)
For how many games was the score 1 or more?
(a)

What percentage of values are between 52 and 60?
f=
25%
50%
75%
100%
What percentage of values are between 52 and 64?
25%
50%
75%
100%
What percentage of values are between 60 and 70?
25%
50%
75%
100%

Median=

Median=

Median=

Median=

Median=

Median=

Median=

Median=

Median=

Median=

Median=

Median=

Median=

Median=

Median=

Median=
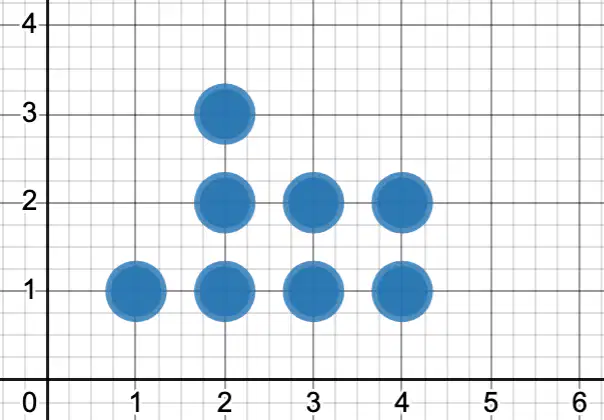
Median=
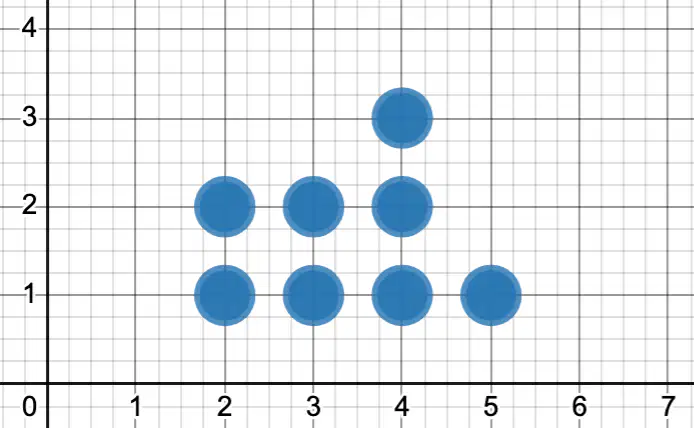
Median=
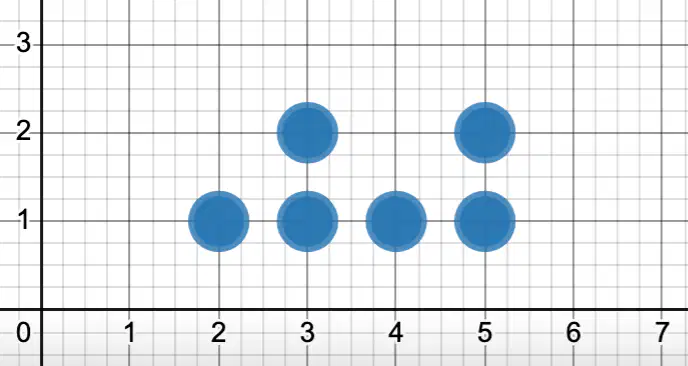
Median=
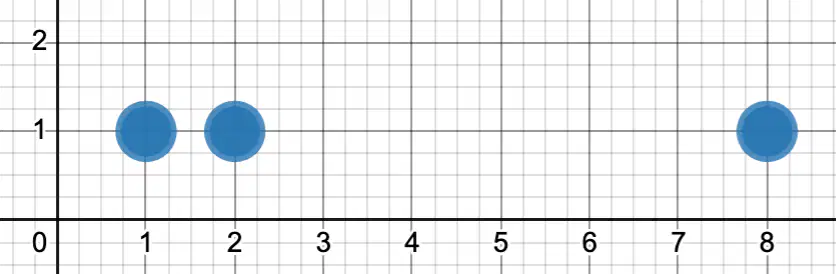
Median=
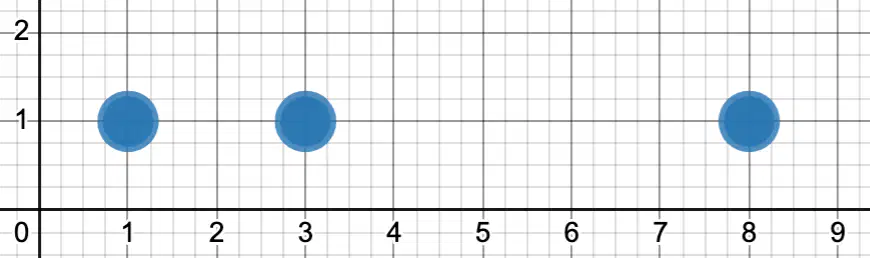
Median=
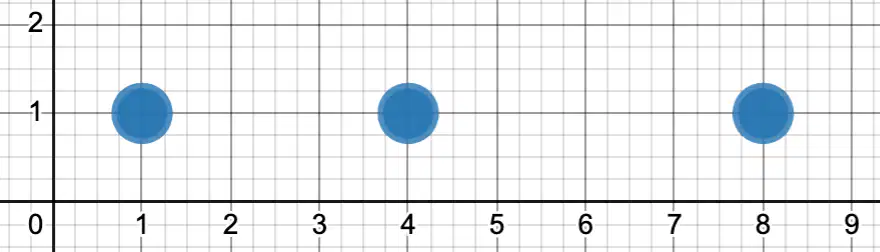
Median=
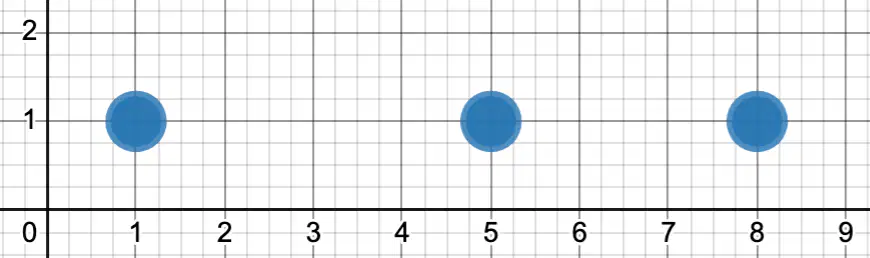
Median=
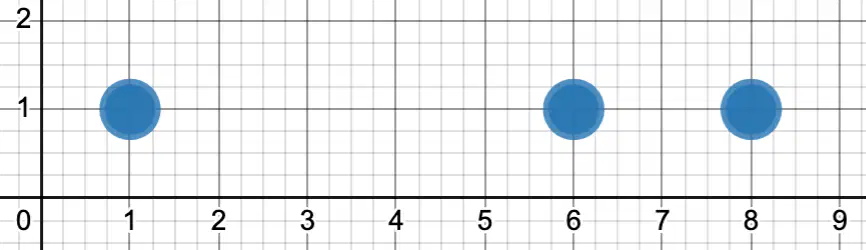
Median=
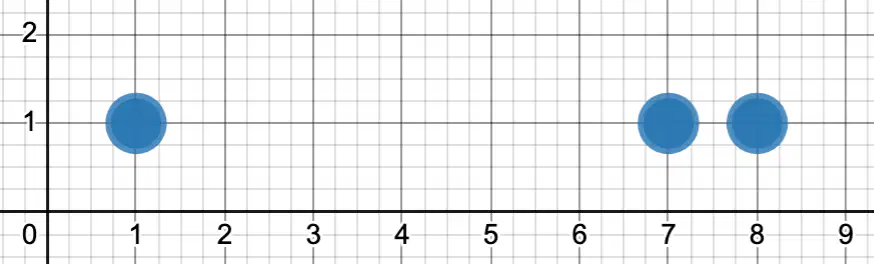
Median=
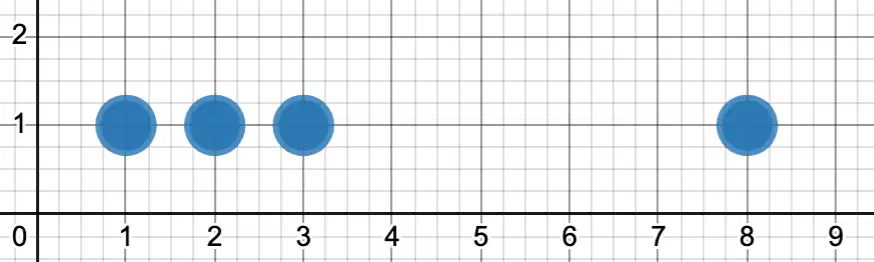
Median=
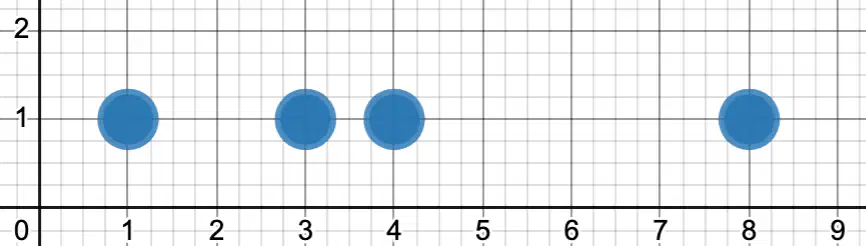
Median=
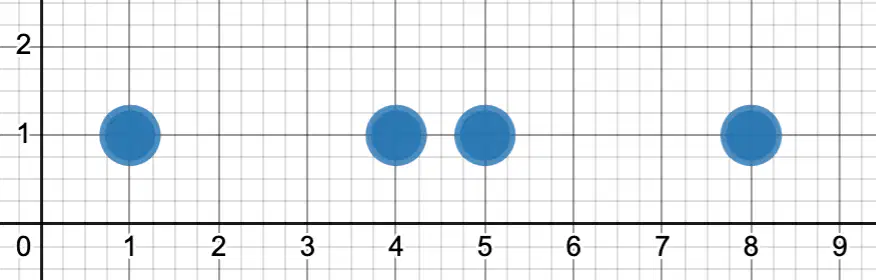
Median=
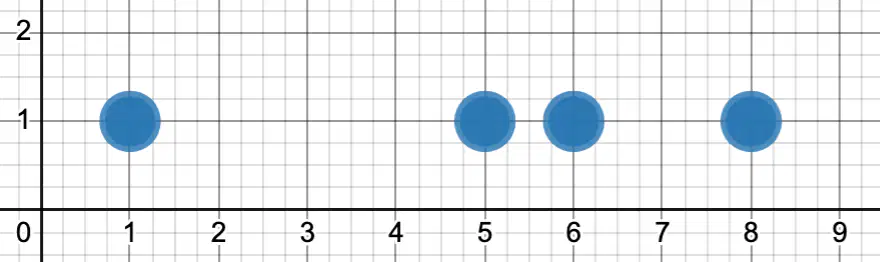
Median=
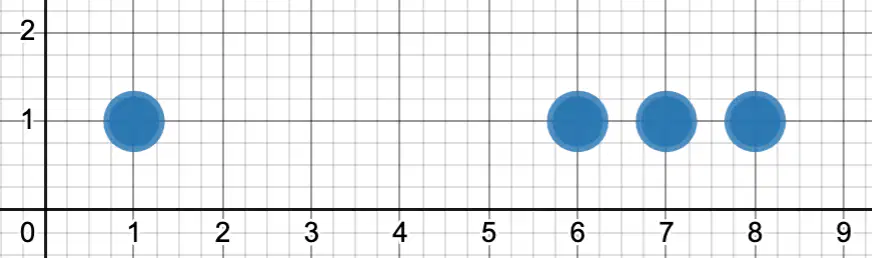
Median=
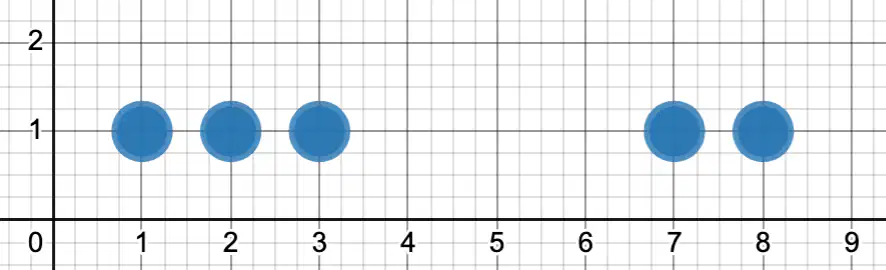
Median=
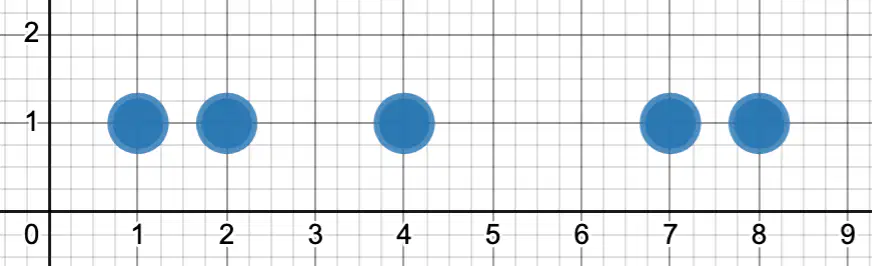
Median=
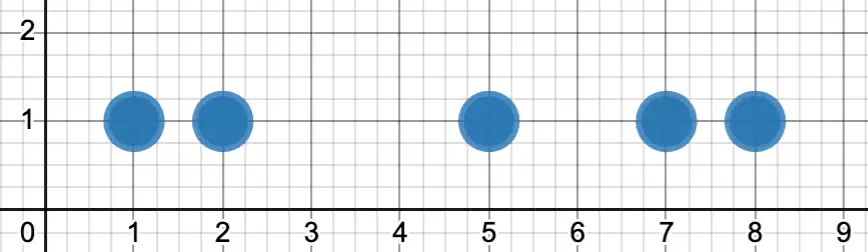
Median=
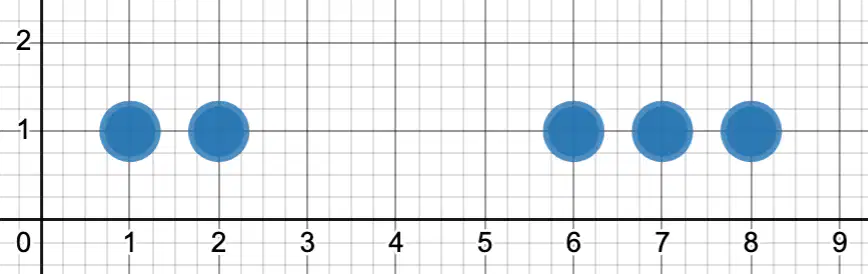
Median=
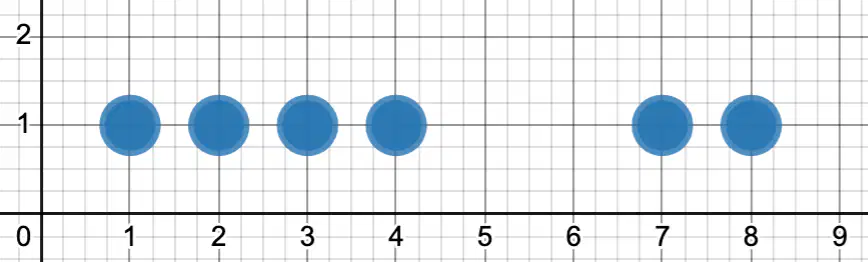
Median=
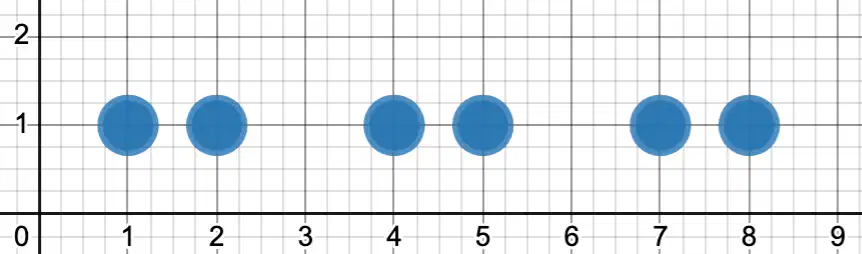
Median=
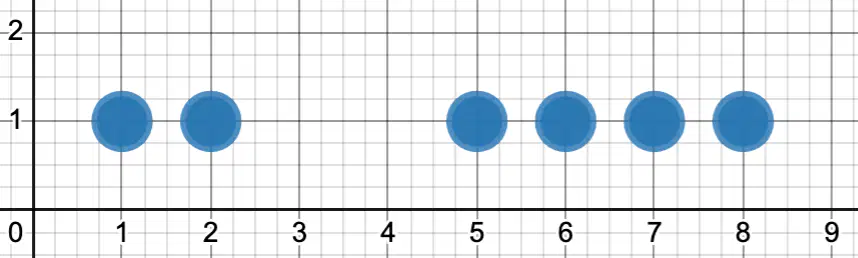
Median=
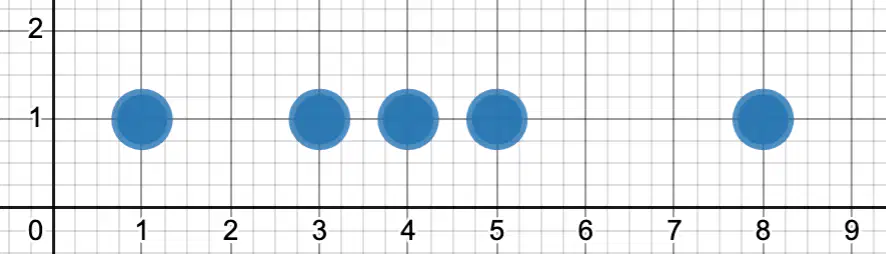
Median=
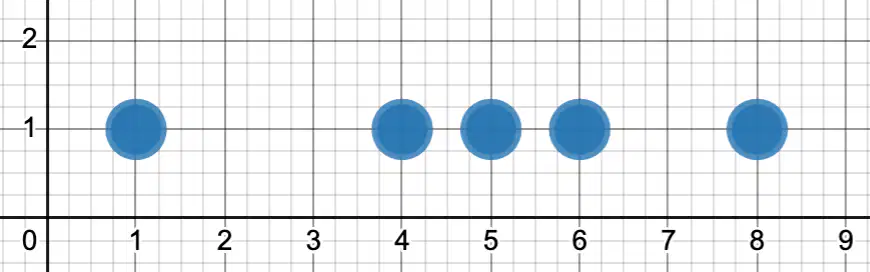
Median=
What percentage of values are between 52 and 70?
25%
50%
75%
100%
What percentage of values are between 52 and 82?
25%
50%
75%
100%

