
 Worksheets
Statistics - Practice Revision
Total questions: 73
Worksheet time: 2hrs 14mins
The whole group of people/objects in a group that you want to survey is called the...
Population
Sample
Variable
Data
What is the mean of this set of data?
2, 15, 7
24
3
6
8


The middle number, once data is made ordinal
Mean
Mode
Median
Range
The average of all data sets is more formally known as the...
mean
median
range
mode
An error that occurs from the respondents all sharing the same characteristic is known as a...
Sampling Error
Stratified Error
Non-Response Error
Sharing Error
The number that falls in the middle of all data is referred as the...
mean
median
range
mode
A survey that seeks information from the entire population is known as a...
Sample
Census
Survey Group
An error that comes up when not getting any responses is called a...
No Respond Error
Ghosted Error
Non-Response Error
Silent Error
An error that occurs when not enough of the population is sampled is called a....
Non-Response Error
Sampling Error
Coverage Error
Simple Error
What is the formula to calculate the mean of a data set?
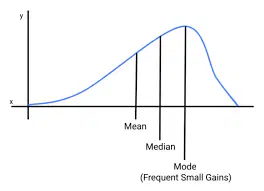
This type of data is ________ skewed
Positively
Negatively
Symetrically

This type of data is ________ skewed.
Positively
Negatively
Symetrically

Which of the following best describes the correlation shown on the graph?
negative correlation
positive correlation
no correlation

Which of the following best describes the correlation shown on the graph?
negative correlation
positive correlation
no correlation

Which of the following best describes the correlation shown on the graph?
negative correlation
positive correlation
no correlation

Which of the following best describes the correlation shown on the graph?
negative correlation
positive correlation
no correlation

Which of the following best describes the correlation shown on the graph?
negative correlation
positive correlation
no correlation

Which of the following best describes the correlation shown on the graph?
negative correlation
positive correlation
no correlation

Which correlation coefficient (r) best represents the graph?
r = -1
r = 0
r = 1.4
r = 1

Which correlation coefficient (r) best represents the graph?
r = -0.95
r = 0
r = -1.4
r = 1

Which correlation coefficient (r) best represents the graph?
r = -0.95
r = 0
r = 2
r = 1
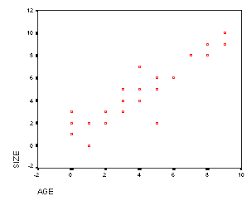
Which correlation coefficient (r) best represents the graph?
r = -0.95
r = 0
r = 0.85
r = 1.1
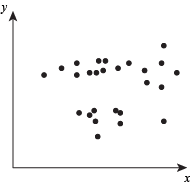
Which correlation coefficient (r) best represents the graph?
r = -0.95
r = 0
r = 0.85
r = 1.1
Describe the correlation, if the correlation coefficient is r = -0.26
Positive, weak
Negative, weak
Positive, strong
Negative, strong
Describe the correlation. r = 0.3
Strong, positive
Weak, positive
Strong, negative
Weak, negative



Estimate the correlation coefficient for this scatterplot.
A) r = 1.2
B) r = 0.89
C)r = 0
D) r = -0.89
As x increases, y increases
A) correlation coefficient
B) causation
C) positive correlation
D) negative correlation
As x increases, y decreases.
A) no correlation
B) negative correlation
C) correlation coefficient
D) positive correlation
Make predictions based on values inside the data points
Interpolation
Extrapolation
Correlations Coefficient
Residual
Make predictions based on values outside the data points
Interpolation
Extrapolation
Correlations Coefficient
Residual
The measure of the strength and direction of a linear relationship
Interpolation
Extrapolation
Correlations Coefficient
Residual

Approximate the daily sugar intake for the participant who consumed 3 soft drinks per week
120g
110g
130g
90g







There would be a strong causality between the number of petrol stations in a town and maximum speed the car can reach.
True
False
There would be a strong causality between number of burgers eaten and score on a maths test.
True
False

To create your box plot,
you must find your
"___ number summary".
complete
three
five
quartile

What are the MINIMUM and MAXIMUM values?
3 and 18
4 and 15
10.5
6 and 13
What is ALWAYS your first step when given a set of data?
Put the numbers in order from greatest to least.
Put the numbers in order from least to greatest.
Find the median.
Find the quartiles.

What does point C on the box plot represent?
First Quartile
Median
Third Quartile
Mean

What do points B and D represent on the box plot?
Mean and Mode
Mean and Median
Least and Greatest Value
First and Third Quartiles
What do points A and E represent on the box plot?
Mean and Mode
Mean and Median
Least and Greatest Value
First and Third Quartiles


For Africa, what percentage of Leopards have a weight less than 80kg?
25%
50%
75%
100%

Which leopard population has the highest minimum weight?
Africa
Asia

A leopard has a weight of 90kg. Is likely to be an Asian or African leopard?
Asian
African

For Asia, what percentage of Leopards have a weight less than 80kg?
25%
50%
75%
100%
If r=0, there is a strong correlation.
True
False
True or False?
"Correlation is not causation" means that just because two things correlate does not necessarily mean that one causes the other.
True
False
There would be a strong causality between distance travelled to work and amount spent on fuel in a week
True
False
There would be a strong causality between the temperature and number of people at the beach
True
False
Is r = -0.87 strong, moderate, or weak?
strong
moderate
weak

The scatter plot below shows the number of books read by students in Mr Hollands' English class and their final grades. Which statement represents the best description about the line of best fit?
The more books students read, the lower their English grade.
The more books students read, the higher their English grade.
The fewer books students read, the higher their English grade.
No relationship exists between the number of books students read and their English grades.
Data is analyzed comparing hours studied and grades. It is determined that the correlation coefficient is 0.92. What does this mean?
There is a strong positive correlation between studying and grades.
There is a strong negative correlation between studying and grades.
There is a weak positive correlation between studying and grades.
There is a weak negative correlation between studying and grades.


