
 Worksheets
APHG Unit 1 MCQ Practice Test
Total questions: 21
Worksheet time: 21mins
Which of the following is the primary assumption of environmental determinism?
Human destiny is controlled by the cultural environment.
The physical environment has little influence on humans.
Humans have complete control over the physical environment
Many human adaptations are possible within a specific physical environment.
The physical environment controls human culture.

Photo: Census form 2010.
A political polling company wants to use census data to collect information on voters in a city by neighborhood. Based on the types of information collected in the survey form, which of the following could be mapped using census data?
The number of voting-age residents per household
The political party affiliation of the average resident
How residents voted in the last election
How voters might vote in the next national election
How voters stand on current issues
Which of the following scales of analysis would provide demographic data that could be used to compare one urban neighborhood to other urban neighborhoods across a country?
State or province
Metropolitan area or urban region
County or parish
City or municipality
Census tract or enumeration area
Which of the following describes the perspective of environmental determinism?
A twentieth-century idea that human cultures are imprinted on the landscape in different forms of land use and architecture
A contemporary ecological view that human activity is affecting the global environment toward a negative outcome
A former scientific viewpoint stating that factors within the physical geography of a region shape the local population’s culture and behaviors
A theory that humans hold the ability to modify Earth’s physical geography to meet the resource needs of a society
A belief system based on an ideology that humans have dominion over Earth and its natural resources
According to the theory of environmental determinism, which of the following areas would have the most productive settlements?
Tropical regions
Temperate regions
Mountainous regions
Arctic regions
Arid regions
Which of the following terms best describes regions that make up the political geographic divisions within a country?
Cultural
Perceptual
Vernacular
Physical
Formal

Photo: TOPOGRAPHIC MAP AND GEOGRAPHIC INFORMATION SYSTEMS (GIS) MAP IMAGE OF MOUNT SHASTA, IN NORTHERN CALIFORNIA
The images show a topographic map and a geographic information systems (GIS) representation of Mount Shasta in California. Which of the following statements best explains why these printed images are geometrically distorted representations of Earth’s surface?
Some maps do not show the actual coloration of Earth’s surface and vegetation.
GIS can only display two-dimensional layers.
The planet’s gravitational poles are not located at the poles of Earth’s axis.
The three dimensions of Earth’s surface are displayed on a two-dimensional page.
Printed maps alter the sense of place that people can have about a location.
Every map projection has some degree of distortion because
a curved surface cannot be represented on a flat surface without distortion
parallels and meridians never cross at right angles on a globe
the grid system is two-dimensional, while the real world is three-dimensional
Earth is not a perfect sphere
latitude lines are shorter than meridian lines
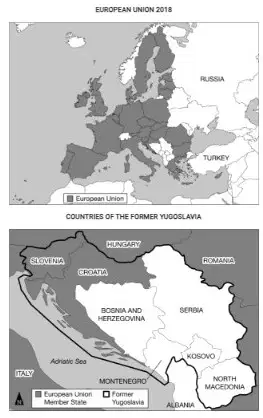
Which of the following best identifies the scale of analysis for each of the maps shown?
Global and regional
Regional and urban
Continental and country
Global and local
Country and local
Why would a town planner use a map at the 1:24,000 scale rather than a map at the 1:250,000 scale?
The map at the 1:24,000 scale shows a much larger area.
The map at the 1:24,000 scale is easily converted to non-metric measurements.
The map at the 1:24,000 scale shows the town close-up in more detail.
The map at the 1:250,000 scale shows the town in too much detail.
The map at the 1:250,000 scale shows too small of an area to see the whole town.
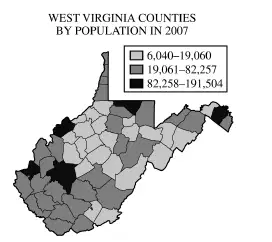
The map shown above best fits which of the following map types?
Choropleth
Cartogram
Proportional symbol
Dot symbol
Isoline
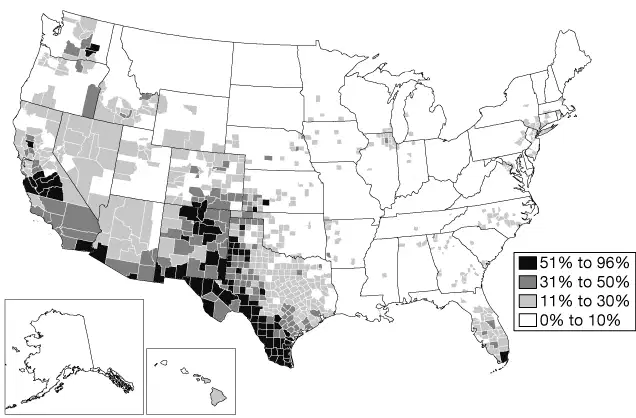
Photo: HISPANIC POPULATION PERCENTAGE BY COUNTIES IN THE UNITED STATES, 2010
Which of the following is a limitation of the map of Hispanic population percentage?
The small size of urban counties in the eastern United States masks the significance of the Hispanic population in most eastern cities.
Larger county sizes in the western United States mask the significance of the Hispanic population in most western counties.
States with the largest total populations mask the significance of the Hispanic population in those states.
States with the smallest total populations mask the significance of the Hispanic population in those states.
The pattern shown is not different than the pattern of early Hispanic settlement during the era of colonization
Which of the following concepts could best be explained by the theory of possibilism?
Regional differences between the internal structures of cities
Changes in population growth rates over time
Limitations on agricultural crops based on climate
Political patterns seen in election maps
Modification of landscapes by human cultures
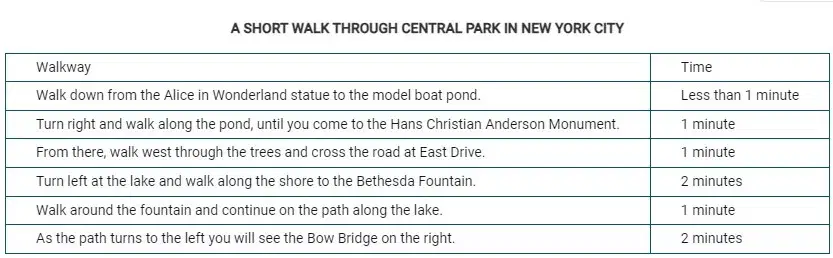
Which of the following best describes the type of information provided in the directions?
Absolute location
Relative location
Cultural landscape
Geographic information systems
Cartographic principles
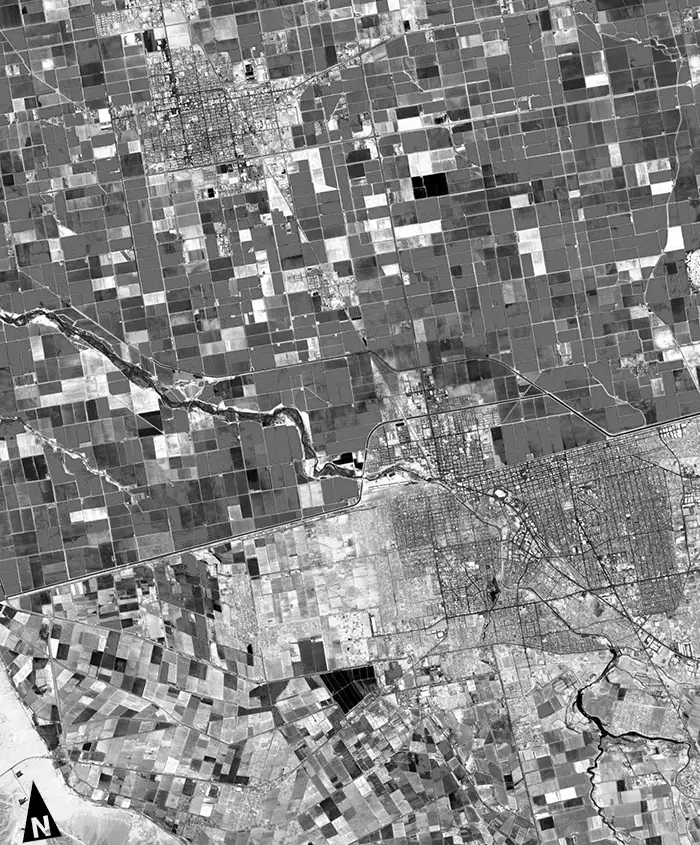
Photo: IMPERIAL VALLEY ALONG THE UNITED STATES–MEXICO BORDER
Which of the following best describes the data presented in the image?
Coordinates for a satellite navigation system
Political map of a region
Series of geographic information systems layers
Remote sensing satellite image of land use
Cartogram of quantitative spatial information
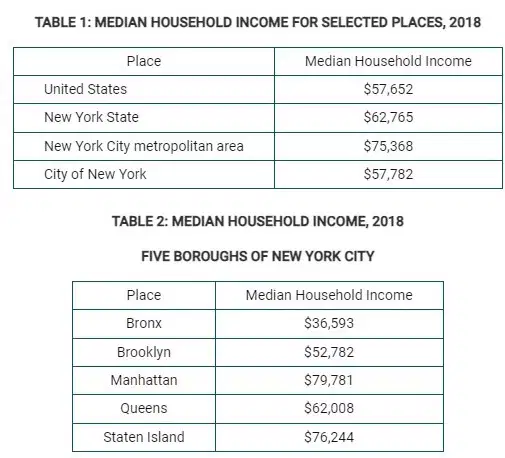
Table 1 shows that the United States and New York City have similar median household income values. Compare the data in Table 1 to the data in Table 2. Based on this comparison, which of the following statements is most accurate?
Each borough of New York City has a household income distribution similar to that of the United States.
Each borough of New York City has a household income distribution similar to that of New York State.
Each borough of New York City has a household income distribution similar to that of the New York City metropolitan area.
Each borough of New York City has a household income distribution similar to that of the City of New York.
A comparison of data from one scale to a different set of scales can result in a flawed analysis.
The data on median household income in Table 1 is presented in different
culture regions
physical regions
map scales
scales of analysis
vernacular regions
The "why of where" refers to
geography's emphasis on landscape features
spatial patterns on the landscape
a definition of geography that is simply locational
the idea that the explanation of a spatial pattern is crucial
the depiction of a region's physical features
Which of the following are the best examples of vernacular regions?
The Canadian Maritimes and the Northwest Territory
The American West and the American Midwest
South Africa and Australia
South America and the Caribbean
Scandinavia and the Iberian Peninsula
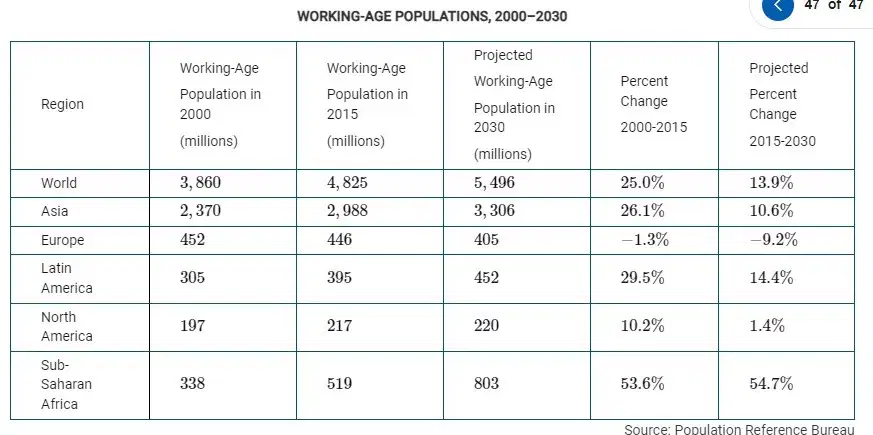
An international company is looking to expand its network of factories, which use labor-intensive production methods, in a region of the world experiencing significant growth in the working-age population. Based on the data in the table, which of the following regions should the company choose?
North America, which will have faster working-age growth in 2015 to 2030 than in 2000 to 2015
Asia, which will have a faster working-age growth rate in 2015 to 2030 than in 2000 to 2015
Latin America, which had the fastest working-age growth rate among world regions from 2000 to 2015
Asia, which will have the fastest working-age growth rate among world regions from 2015 to 2030
Sub-Saharan Africa, which will have the fastest working-age growth rate among world regions from 2015 to 2030
An international company is looking to expand its network of factories, which use labor-intensive production methods, in a region of the world experiencing significant growth in the working-age population. Based on the data in the table, which of the following regions should the company choose?
North America, which will have faster working-age growth in 2015 to 2030 than in 2000 to 2015
Asia, which will have a faster working-age growth rate in 2015 to 2030 than in 2000 to 2015
Latin America, which had the fastest working-age growth rate among world regions from 2000 to 2015
Asia, which will have the fastest working-age growth rate among world regions from 2015 to 2030
Sub-Saharan Africa, which will have the fastest working-age growth rate among world regions from 2015 to 2030

