wayground logo

Free Printable Worksheets

NEW

Font size

S
M
L
XL
Worksheets

1.2 to 1.4 Practice

Total questions: 76

Worksheet time: 3hrs 20mins

Name
Class
Date
1.

What is the range (maximum-minimum) of the data shown?

a)

85

b)

90

c)

80

d)

70

2.

Which interval shows the greatest number of pets?

a)

15-19

b)

0-4

c)

5-9

d)

10-14

3.

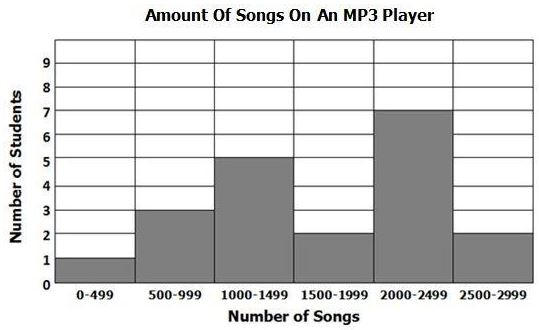
How many students have more than 1,000 songs on their MP3 player?

a)

5

b)

16

c)

10

d)

4

4.
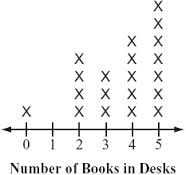
How many people have four books in their desks?
a)
2
b)
3
c)
4
d)
5
5.

Which box and whisker plot has the highest median?

a)

First plot

b)

Second plot

6.

What value is the lower quartile (Q1)?

a)

66

b)

58

c)

60

d)

64

7.

What data value is the upper quartile (Q3)?

a)

64

b)

62

c)

66

d)

58

8.

What is the interquartile range (IQR=Q3-Q1)?

a)

4

b)

64

c)

60

d)

8

9.
What is the minimum value?
a)
64
b)
58
c)
66
d)
60
10.
What is the maximum value?
a)
58
b)
66
c)
64
d)
60
11.
What is the median?
a)
62
b)
58
c)
66
d)
60
12.

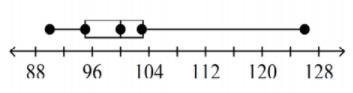
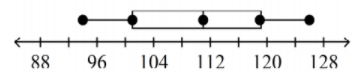
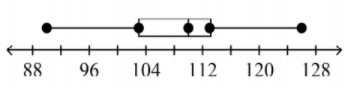
Which box plot represents the data below? (HINT: Use a Calculator to find the five-number summary)


90, 91, 93, 93, 95, 96, 98, 99, 101, 110, 112, 113, 123, 125, 126
a)

b)

c)

d)

13.

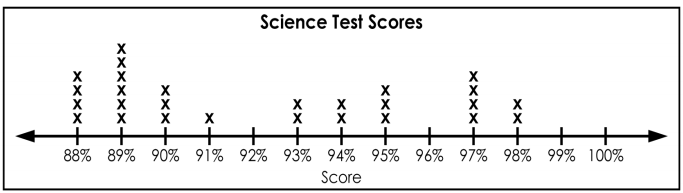
How many more students scored a 88 than scored a 98 on the science test?

a)

4

b)

2

c)

6

d)

35

14.

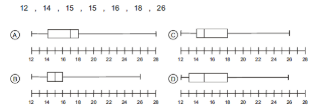
The data shows the heights of students in a class. Which box plot is correct?

a)

A

b)

B

c)

C

d)

D

15.
How many students received a score of 94%? 
a)
94
b)
4
c)
1
d)
2
16.
Find the mean of these numbers:
5,11,2,12,4,2
a)
4.1
b)
6
c)
4.5
d)
4
17.
What is the mean?
4,5,6,7,3,4,10,1
a)
40
b)
48
c)
5
d)
8
18.
Find the median:
5, 6, 3, 9, 0, 4, 1, 2, 7
a)
4
b)
4.1
c)
5
d)
4.5
19.

The height of three basketball players is 210 cm, 220 cm and 191 cm.

What is the mean of their heights?

a)

210

b)

207

c)

220

d)

200

20.
What type of graph is this?
a)
Bar Graph
b)
Histogram
c)
Line Plot
21.
What is the least value?
a)
52
b)
0
c)
13
d)
10
22.
How many people watched more than 6 hours of TV?
a)
10
b)
5
c)
20
d)
17
23.
Which interval has 400 employees?
a)
33-43
b)
0-10
c)
77-87
d)
66-76
24.
Which interval has the greatest number of employees?
a)
11-21
b)
33-43
c)
77-87
d)
44-54
25.
How many employees have a salary less than $22,000?
a)
50
b)
350
c)
0
d)
10
26.
How many students are between 48 and 51 inches tall?
a)
14
b)
8
c)
2
d)
0
27.

Which interval has the greatest number of students?
a)
48-51
b)
56-59
c)
60-63
d)
64-67
28.
How many students are between 60 and 63 inches tall?
a)
3
b)
0
c)
12
d)
7
29.
How many people watched between 6 and 10 hours of TV last week?
a)
31
b)
22
c)
15
d)
35
30.
Type of Data arrangement
a)
Symmetrical
b)
Hairline
c)
Skewed Right
d)
Skewed Left
31.
What is the shape of the distribution?
a)
Skewed Left 
b)
Skewed Right
c)
Symmetric
d)
Bimodal
32.
What is the shape of the distribution?
a)
Skewed Left 
b)
Skewed Right
c)
Symmetric
d)
Bimodal
33.

Describe the histogram:

a)

Left Skewed

b)

Normal or Bell-Shaped

c)

Right Skewed

d)

Uniform or Flat

34.

Describe the shape of the graph.

a)

Skewed right

b)

Skewed left

c)

Uniform or Flat

d)

Normal or Bell-Shaped

35.

What is the shape of the distribution?

a)

Skewed Left

b)

Skewed Right

c)

Symmetric

d)

Bimodal

36.
What is the term for the median of the lower half of the data?
a)
Lower Quartile
b)
Upper Quartile
c)
Median
d)
Maximum
37.
What shape is the data shown in the dot plot?
a)
symmetrical
b)
skewed left
c)
skewed right
38.
What is the range of the data shown?
a)
85
b)
90
c)
80
d)
70
39.
The shape of the data is skewed left.
a)
TRUE
b)
FALSE
40.
Which restaurant has a higher median wait time?
a)
Lucy's Steakhouse
b)
Gary's Grill
c)
They are the same
41.
What is the shape of the data for Lucy's Steakhouse?
a)
Symmetrical
b)
Skewed Left
c)
Skewed Right
42.
What is the range in gas mileage for SUVs?
a)
2
b)
3
c)
4
d)
6
43.
Which statement correctly describes the shapes of the dot plots for cars and SUVs?
a)
SUVs: symmetrical
Cars: skewed left
b)
Both are skewed left
c)
Both are symmetrical
d)
SUVs: skewed right
Cars: Skewed left
44.

What is the IQR of the Cruisers? (IQR = Q3-Q1)

a)
6
b)
4
c)
13
d)
11
45.
Which club has the smaller spread?
a)
Cruisers
b)
Car Hops
46.
How many students have more than 1,000 songs on their MP3 player?
a)
5
b)
16
c)
10
d)
4
47.
Describe the histogram:
a)
Left Skewed
b)
Symmetrical
c)
Right Skewed
d)
Uniform
48.
Describe the shape of the graph.
a)
Skewed right
b)
Skewed left
c)
Uniform
d)
Symmetrical
49.
How many people have two or less books in their desk?
a)
4
b)
5
c)
6
d)
7
50.
Describe the shape of the graph.
a)
Skewed right
b)
Skewed left
c)
Uniform
d)
Symmetrical
51.
a)
the spread of 5th period is greater than 2nd period
b)
the spread of 2nd period is greater than 5th period
c)
5th period is skewed right
52.
a)
symmetric, with outliers
b)
symmetric, with no outliers
c)
skewed to the left
d)
skewed to the right 
53.
a)
the shapes of both plots are symmetrical
b)
the data spreads for both populations are the same
c)
Route 9 is skewed left
d)
Route 9 is skewed right
54.
What is incorrect about the following histogram?
a)
The intervals are too small
b)
The intervals overlap
c)
The graph does not start at 0
d)
The axes are not labeled.
55.
Is the Cars dot plot skewed left or right?
a)
left
b)
right
56.
Which is the correct data set for the dot plot?
a)
1, 2, 3, 4, 5, 6, 7, 8, 9, 
b)
1, 2, 2, 3, 3, 3, 4, 4, 4, 4, 5, 5, 5, 7, 9
c)
1, 2, 3, 4, 5, 7, 9
57.
Where is the gap?
a)
Between 0 and 5
b)
Between 6 and 7 students
c)
Between 8 and 12 
d)
13 students
58.
What does the mean represent in a set of numbers?
a)
the middle number
b)
the average number
c)
the number the appears most often
d)
the highest number
59.
What does the median represent in a set of numbers?
a)
whatever number is in the middle of the list, regardless of the value of the numbers
b)
the number that represents the middle value in the set of numbers
c)
the number that appears most often
d)
the average number
60.
What does the mode represent in a set of numbers?
a)
the middle number
b)
the average number
c)
the number the appears most often
d)
the highest number
61.
True or False: The mean and the average are the same number.
a)
True
b)
False
62.
If you take 5 quizzes and get scores of 95%, 95%, 80%, 85%, and 75%, how would you find your mean quiz score?
a)
Find the score that is in the middle.
b)
Add all the scores together and divide by the number of scores.
c)
Add 95 + 80 + 85 + 75 together and divide by 4.
d)
Identify the quiz score that appears most often.
63.
How do you find the median of the set of numbers that are not listed in order, like 1, 2, 4, 3, 5, 3,6, 7, 8?
a)
Pick the number you see in the middle.
b)
Start crossing out at each end until you come to a number in the middle.
c)
Rewrite the numbers in order from lowest to highest first, then find the number in the middle.
d)
Pick the number that appears most often.
64.
What is the mode of 3, 3, 4, 5, 10?
a)
3
b)
4
c)
5
d)
10
65.
What is the median of 0, 1, 2, 6, 6?
a)
2
b)
3
c)
5
d)
6
66.
Your basketball team plays 5 games.
Your team scores:
10 points in the first game,
3 points in the second game,
2 points in the third game,
5 points in the fourth game, and
0 points in the fifth game.
What was the mean number of points your team scored for all 5 games?
a)
3 points
b)
4 points
c)
5 points
d)
10 points
67.
A play has 7 people with all different ages:
10, 10, 12, 14, 22, 13, and 24.
What is the median age of participants in the play?
a)
14
b)
10
c)
13
d)
15
68.

Johnathan analyzed a set of data. He noticed that 50% of the data was

between 84 and 89. He also noticed that 50% of the data was between

88 and 91. The lowest data point was an 82. Which box plot could

represent the set of data Johnathan analyzed?

a)
b)
c)
d)
69.

Which has a higher median?

a)

Florida

b)

Texas

70.

Which has a lower IQR? (Interquartile Range)

a)

Florida

b)

Texas

71.

Which has the higher median?

a)

Thanksgiving

b)

New Years Eve

72.

Which has a higher median?

a)

6th graders

b)

4th graders

73.

Which group of people has 50% of the data above 5 magazines each day?

a)

Children

b)

Adults

74.

What percent of the data falls between 8 and 10 absences?

a)

0%

b)

25%

c)

50%

d)

75%

e)

100%

75.

What percent of students read between 280 and 340 words per minute (wpm)?

a)

0%

b)

25%

c)

50%

d)

75%

e)

100%

76.

What percent of the data is below 80?

a)

0%

b)

25%

c)

50%

d)

75%

e)

100%