
NEW
Font size
 Worksheets
Benchmark 1 Review
Total questions: 36
Worksheet time: 44mins




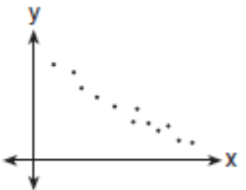
Estimate the correlation coefficient for this scatterplot.
A) r = -0.9
B) r = 1
C) r = 0.9
D) r = -1
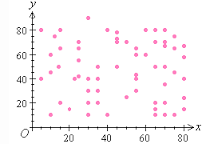
What type of correlation does this graph show?
A) Positive
B) negative
C) none
D) all of the above
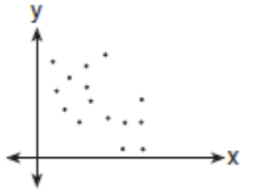
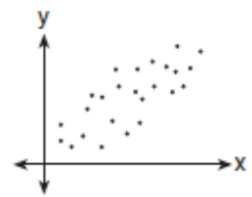
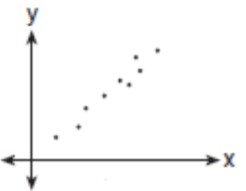
Which graph represents data that has a correlation coefficient close to -1?
Two variables have a positive association when
the value of one variable tends to increase as the other variable increases.
the value of one variable tends to increase as the other variable decreases.
the value of one variable tends to increase regardless how the other variable change.
the values of both variables are always positive.
Coefficient of correlation lies between
0 and +1
0 and -1
-1 and +1
-5 and +5


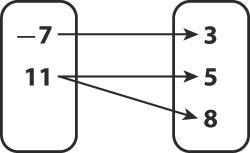
Is the relation a function? Explain.
Yes, the x-value 11 has two y-values paired with it.
Yes, each x-value has only one y-value paired with it.
No, the x-value 11 has two y-values paired with it.
No, each x-value has only one y-value paired with it.
Does the following relation represent a function?
(1,5), (1,6), (1,7), (1,8), (1,9)
Yes, there are no repeated x-values
No, there are repeated x-values
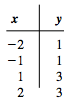
Does the table represent a function?
Yes
No

Does the graph represent a function?
Yes
No
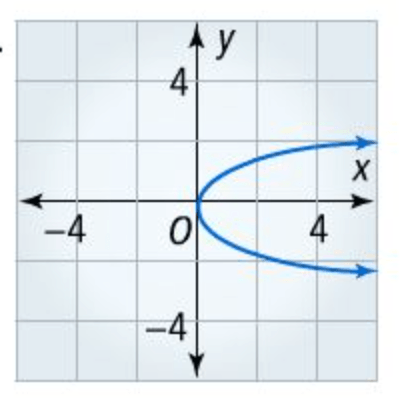
Does the graph represent a function?
Yes
No
x + 5 ≤ 13
7k – 2 ≥ -9

77 ≤ 5 + 8n
Solve m - n = 5 for m.
m = n + 5
m = n - 5
m = 5n
m = 5 - n
Solve IR = V for R.
R = IV
R = I/V
R = V/I
R = V - I
Solve:
y = mx + b , for b
b = y - mx
b = y + mx
b = mx - y
b = -y - mx
a = b + c , for c
c = a - b
c = a + b
c = ab
c = a/b

