
Font size
 Worksheets
Unit 1 Physics Quiz Review: Equilibrium
Total questions: 15
Worksheet time: 15mins
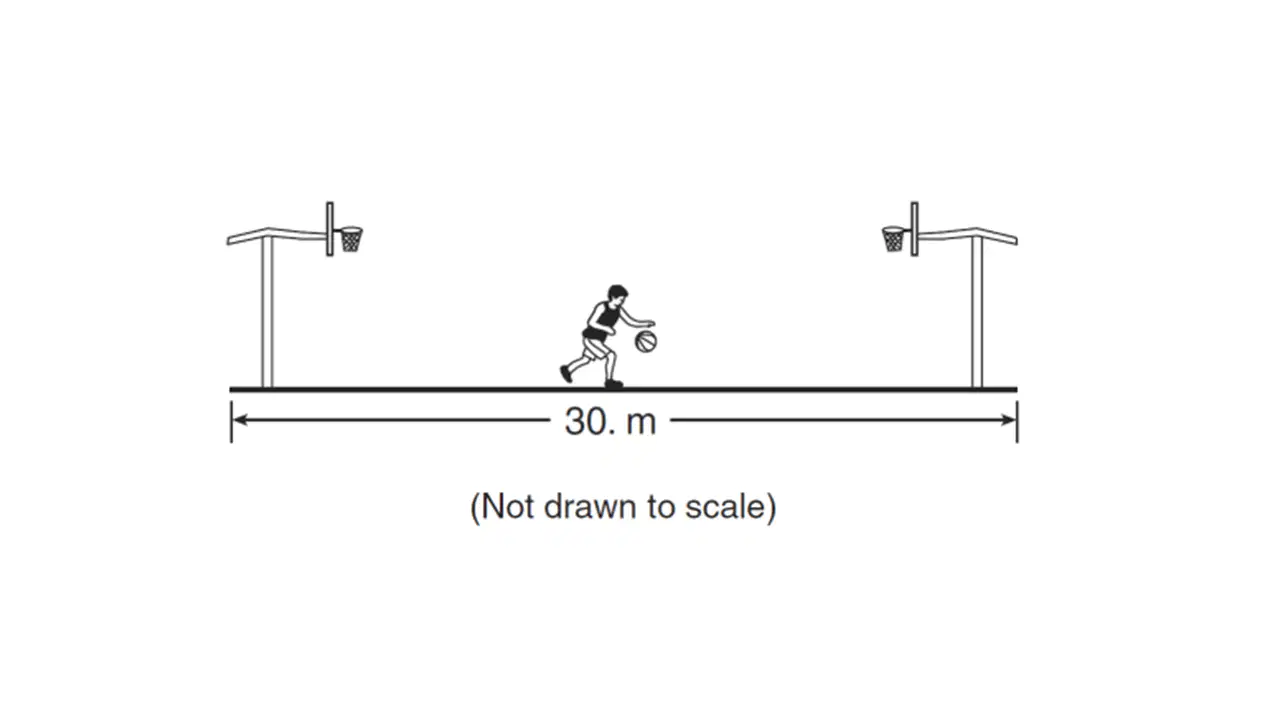
In a drill, a player runs the length of the 30 m court and back.
The player does this three times in 60 seconds.
The average speed of the player during the drill is...
0.0 m/s
0.50 m/s
3.0 m/s
0.39 m/s
2.5 m/s
A student on an amusement park ride moves 35 m in 8.9 s. The student moves at an average speed of ...
3.9 m/s
1.2 m/s
2.5 m/s
4.3 m/s
A baseball player runs 27..4 m from the batter's box to first base, overruns the base by 3 m and then returns to first base. Compared to the total distance traveled by the player, the magnitude of the player's total displacement from the batter's box is
3 m shorter
6 m shorter
3 m longer
6 m longer
A high speed train travels a distance of 300000 m in 3600 s What is the average speed of the train?
0.012 m/s
0.083 m/s
12 m/s
83.3 m/s
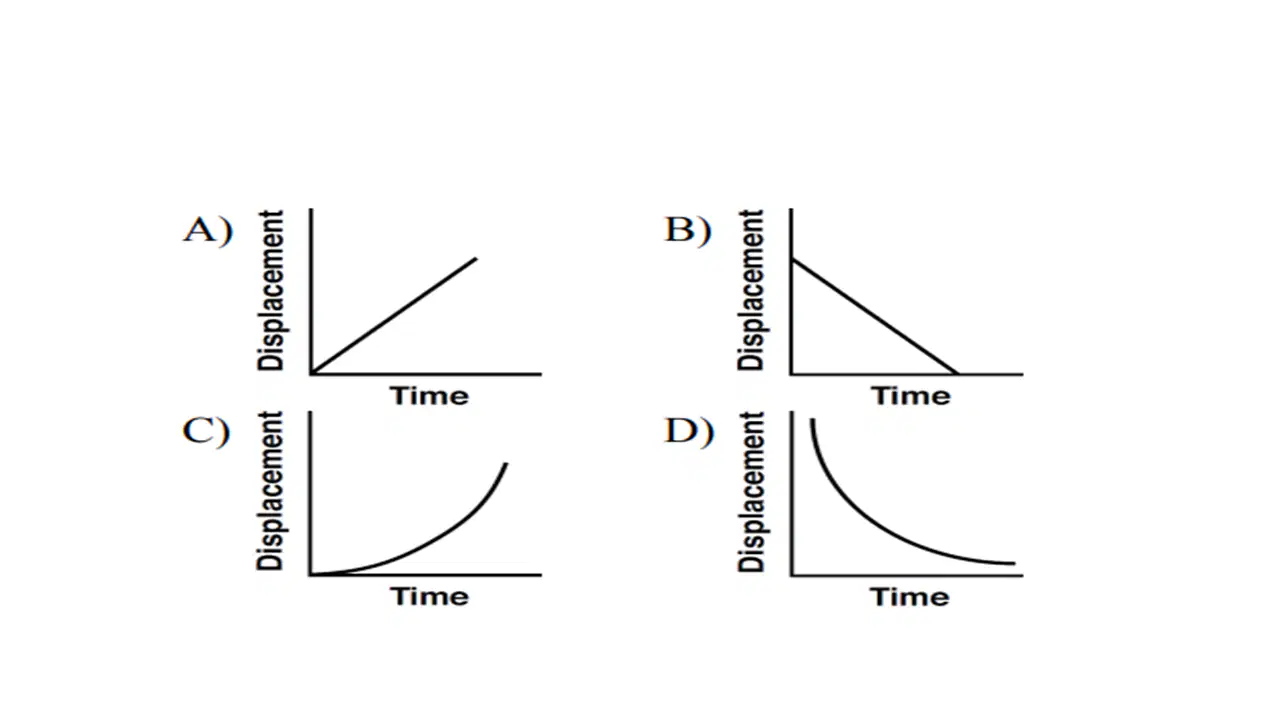
Which graph best represents the motion of an object traveling at a constant positive velocity?
A
B
C
D
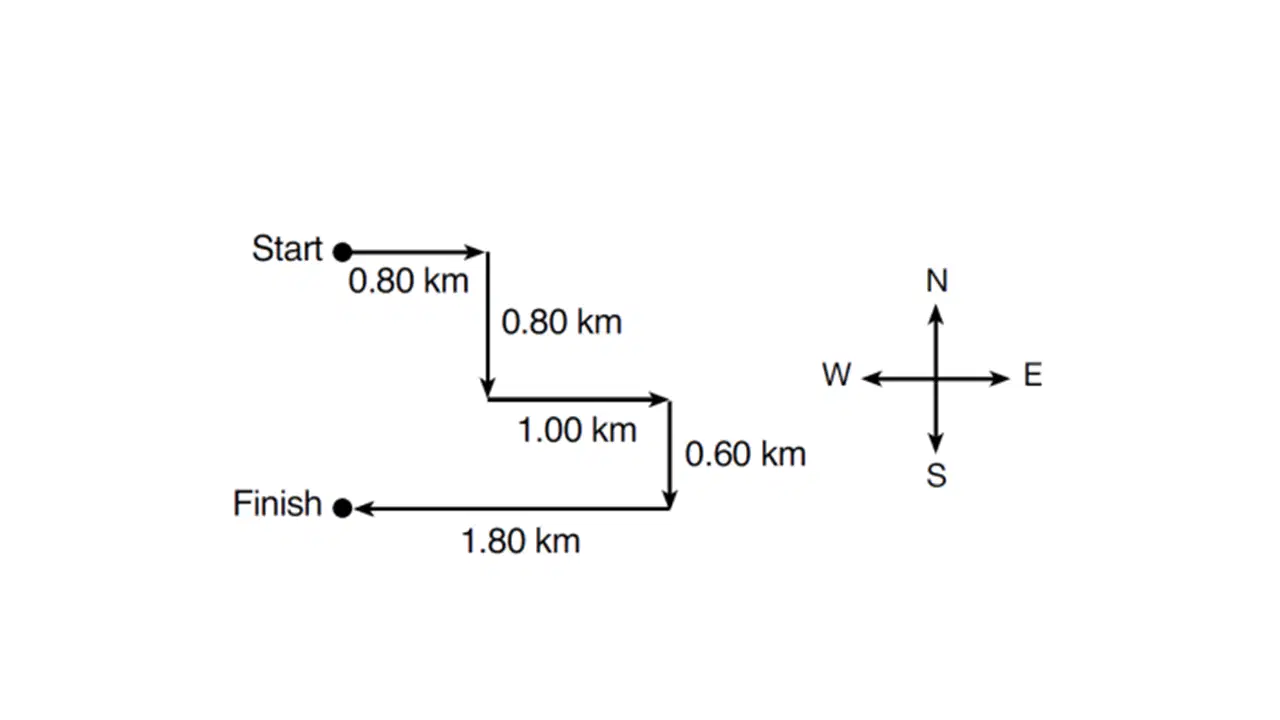
The displacement of the student from start to finish is
1.40 km north
1.40 km south
5.00 km north
5.00 km south
The magnitude of an unbalanced force applied to a 4 kg crate is 10 N. If the magnitude of this applied unbalanced force is doubled, the inertia of the crate is
Halved
unchanged
doubled
quadrupled
A 12 kg cart is moving at a speed of 0.25 m/s. After the speed of the cart is tripled, the inertia of the cart will be
unchanged
one-third as great
three times greater
nine times greater
Which terms identify two scalar quantities?
Force and Acceleration
Impulse and Distance
Mass and Velocity
Energy and Time
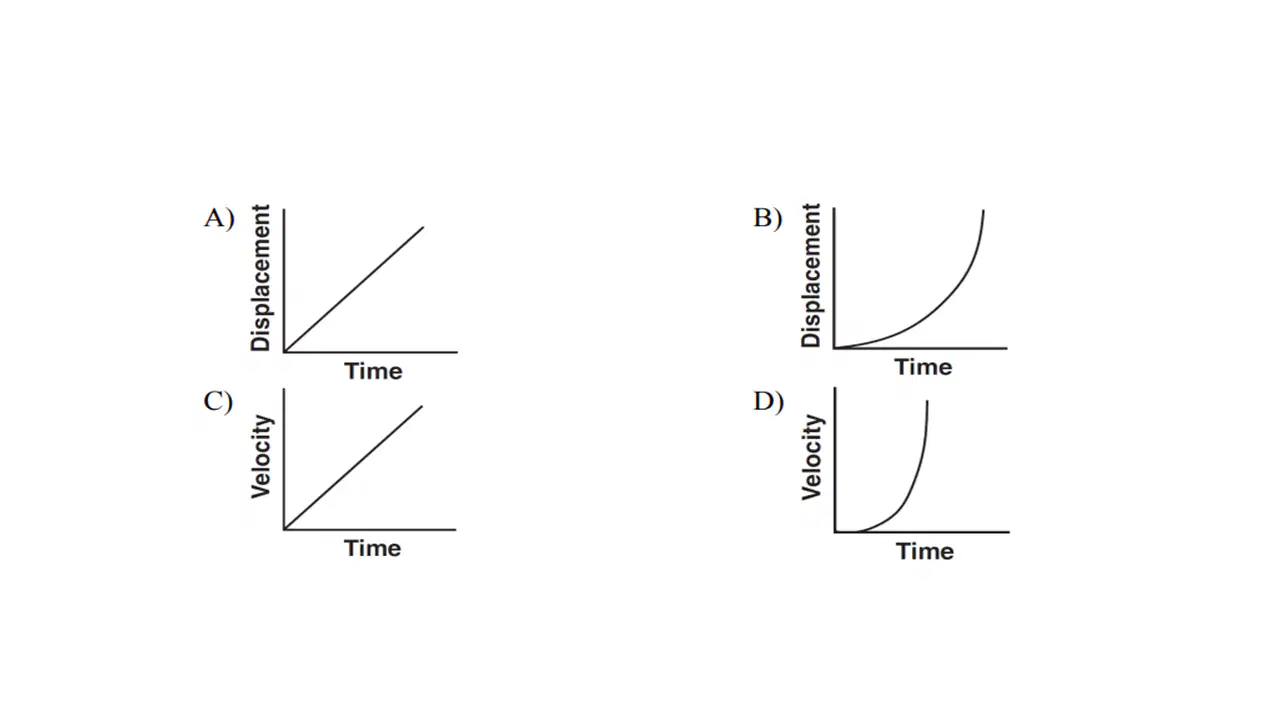
Which graph best represents the motion of an object in equilibrium?
A
B
C
D
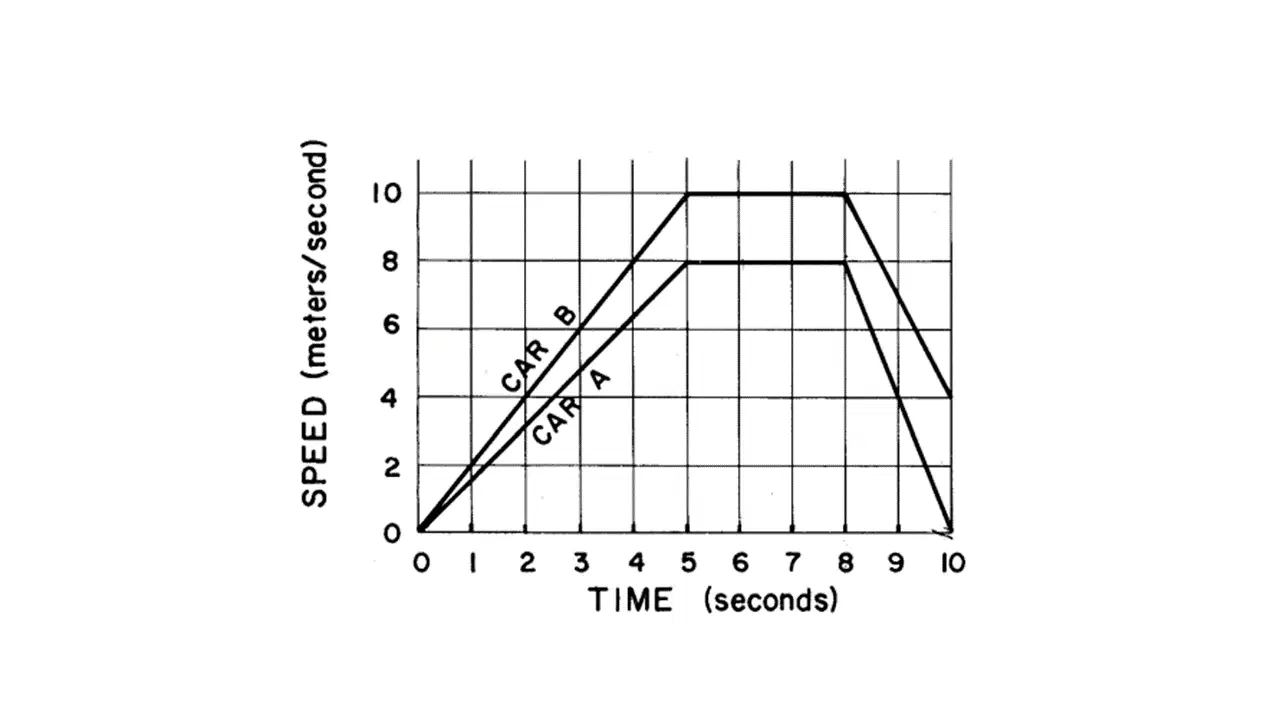
Car A and B both start from rest at the same location at the same time.
Compared to the speed of car B at 6 seconds, the speed of car A at 6 seconds is
Less
Greater
The Same
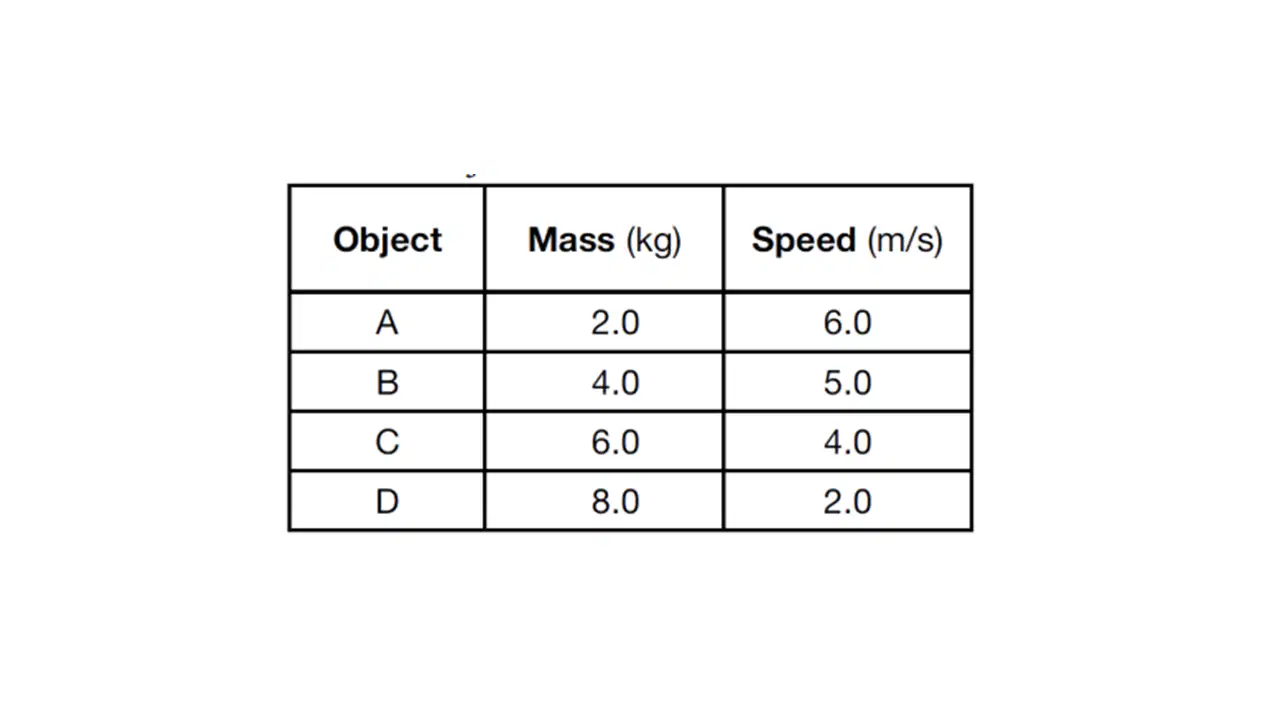
The Data table lists the mass and speed of four different objects.
Which object has the greatest inertia
A
B
C
D
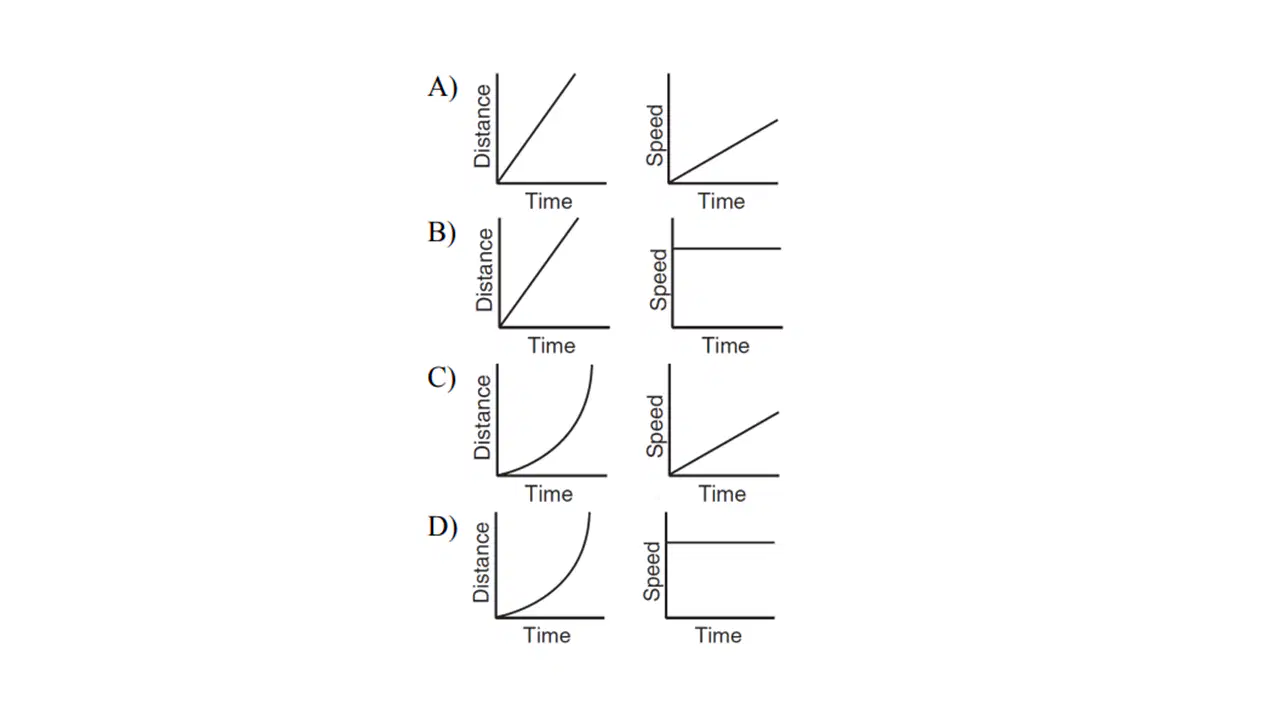
Which two graphs represent the motion of an object on which the forces are balanced?
A
B
C
D
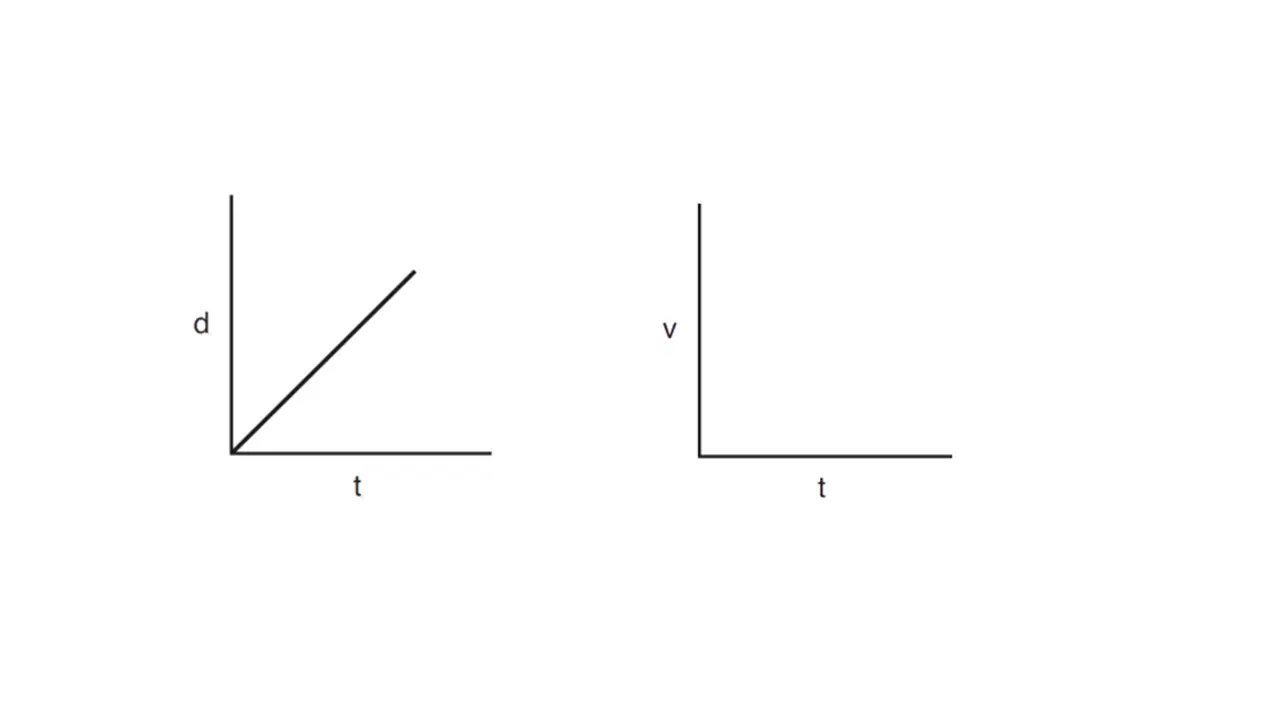
The first graph shows the relationship between distance and time for a moving object.
On the second graph, sketch the general shape of the graph that shows the relationship between the magnitude of the velocity, v, and time, t, for the moving object.
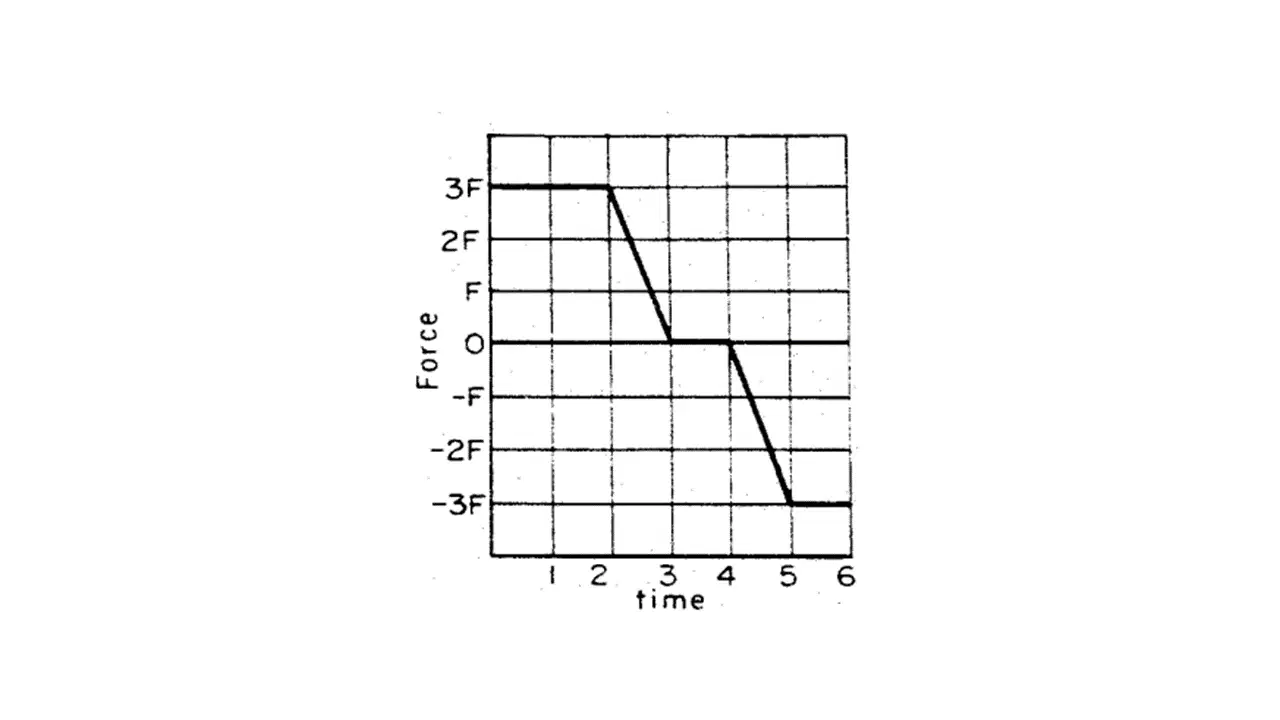
The graph represents the net force acting on an object over time. During which time interval is the velocity of the object constant?
0 to 2
2 to 3
3 to 4
4 to 5

