
Font size
 Worksheets
Graphical Presentation of Data
Total questions: 10
Worksheet time: 6mins
To make a graph effective, certain considerations must be observed, includings
Choosing the coordinate scales
Labelling the curves
Labelling the plotting data
Preparing the title properly
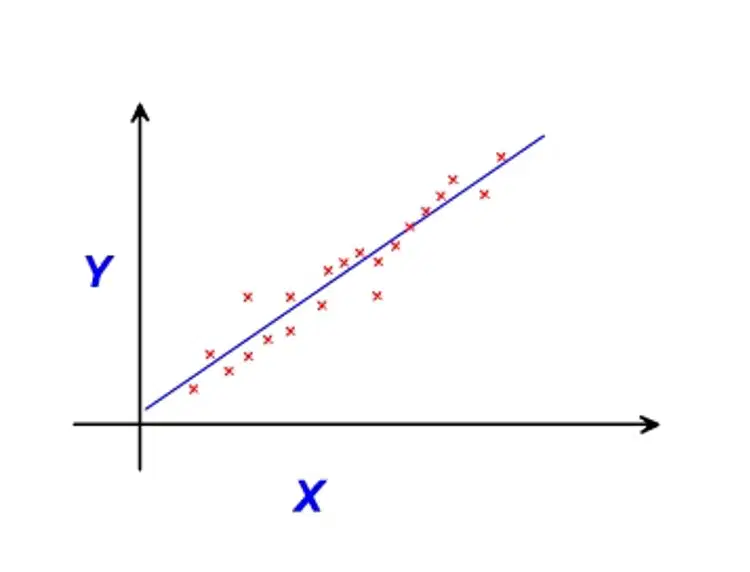
A line of best fit should show the overall trend of the data. The line does not have to go through all of the data point
True
False
Not Sure
What is the function of mathematical model?
Describe the relationship between the variables and its uncertainties
Describe the relationship between the variables in an experiment
Describe the relationship between the variables and the behaviors of system
Describe the relationship between the variables and the line of best fit
A test plot is a graph made with mathematically manipulated data for the purpose of testing a mathematical relation
True
False

The mathematical model for the graph is S = 0.30 m
True
False
Not sure
The basis mathematical model for inverse relation is
y = mx + b
y = ax^2 + bx + c
ln y=bx + ln a
y = ax^2

The process of linearising the side opening parabolas in Figure is known as
Linear relation
Squared relation
Test plot
Mathematical analysis
In engineering, the graph semi-log is plotted when
The limit value of x is very small
The data having a trend of exponential equation
The limit value of y is very big
The data having an equation or trend of power relation
Which graph shows a direct proportional graph?


What is the important element that is missing from the chart?
Gridlines
Line of best fit
Legend
Data labels

