
NEW
Font size
 Worksheets
G8 Benchmark Q1
Total questions: 25
Worksheet time: 13mins
A truck with an initial speed of 20 m/s decelerates at a rate of 4.0m/s2. What distance is covered by the truck before coming to a complete stop?
2.5 m
5.0 m
50 m
100 m
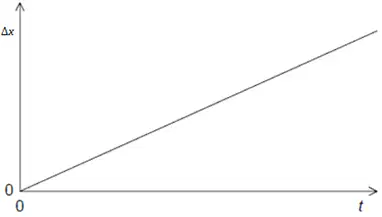
What does the slope of the graph represent?
No physical quantity
Velocity
Acceleration
Impulse

Find the velocity of a moving object between 4 and 6 seconds using the velocity-time graph below.
5 m/s
1 m/s
2 m/s
0 m/s
Convert 61,000 kg into Mg
61,000,000,000 Mg
61,000,000 Mg
61 Mg
0.061 Mg
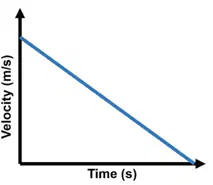
The following velocity-time graph depicts the motion of an object. Which statement is true?
The object is moving backwards
The object will have a decreasing acceleration
The object will have constant positive acceleration
The object will have constant negative acceleration
A unit of acceleration is __________________.
m
m/s
m/s2
kg
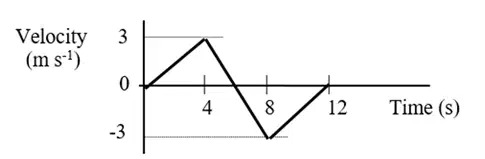
The graph represents the movement of an object along a linear track. The displacement during the 12 seconds is:
0 m
9 m
18 m
36 m
The graph represents the movement of an object along a linear track. The distance during the 12 seconds is:
0 m
9 m
18 m
36 m
The graph represents the movement of an object along a linear track. The distance during the first 6 seconds is:
0 m
9 m
18 m
36 m
The graph represents the movement of an object along a linear track. The displacement during the first 6 seconds is:
0 m
9 m
18 m
36 m
Students are conducting an experiment to investigate if brand of a battery affects how long the battery will run. They hypothesize that a more expensive brands of batteries would result in a longer battery life. The independent variable is:
Size of battery
How long the battery runs
Brand of battery
Temperature of battery
Students are conducting an experiment to investigate if brand of a battery affects how long the battery will run. They hypothesize that a more expensive brands of batteries would result in a longer battery life. The dependent variable is:
Size of battery
Length of time battery works
Brand of battery
Temperature of battery
On planet Earth, a stone is thrown upwards with an initial velocity of + 7.0 m /s and experiences negligible air resistance. What is the stone's velocity after 0.5 s?
0 m/s
1.0 m/s
2.1 m/s
9.8 m/s
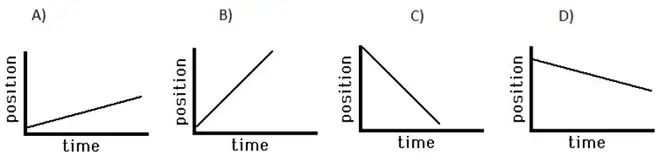
Which of the following graphs shows the largest positive velocity?
Graph A
Graph B
Graph C
Graph D
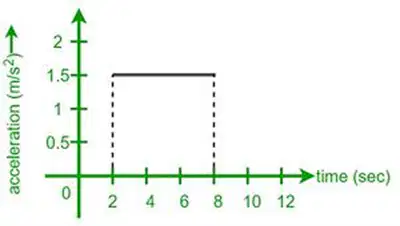
Consider the graph of acceleration vs. time below. Calculate the change in velocity between 2s - 8s.
0 m/s
9 m/s
4.5 m/s
12 m/s
When a ball is thrown straight up with no air resistance, the acceleration at its highest point
is upward
reverses from upward to downward
is zero
is downward
A ball is rolling westward and slowing down as it reaches the end of the lane. The direction of the ball's acceleration is
westward
eastward
northward
southward
A mouse runs 7 m due east, then 10 m due south, and finally 7 m due west. What is the displacement of the mouse from its initial position?
0 m
24 m
10 m due south
10 m due north
A pebble starts at rest and falls a distance of 100 meters in 4.47 seconds. What is the acceleration of the pebble?
2.24 m/s2
10 m/s2
6.69 m/s2
22.4 m/s2
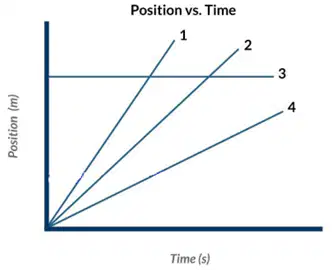
The position-time graphs below represent the motions of cars 1 through 4. How do they rank, according to their speeds (greatest first)?
1, 2, 3, 4
1, 2, 4, 3
4, 3, 2, 1
4, 2, 1, 3
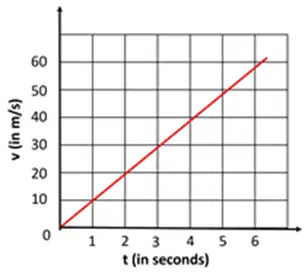
Consider the graph of velocity vs. time below. What are the units defined by the area under the curve of a velocity vs. time graph?
m/s
m
m/s2
s
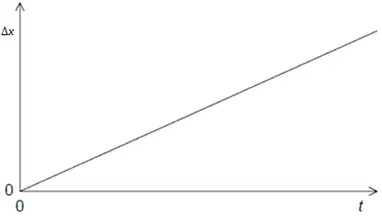
Consider the graph of position vs. time below. What are the units defined by the slope of the position vs. time graph?
m/s
m
m/s2
s
Consider the graph of velocity vs. time below. What are the units defined by the slope of a velocity vs. time graph?
m/s
m
m/s2
s
If you plot a graph to show a relationship between the independent and dependent variables. The dependent variable is graphed on the _________.
x-axis
y-axis
If you plot a graph to show a relationship between the independent and dependent variables. The independent variable is graphed on the _________.
x-axis
y-axis

