
Font size
 Worksheets
RESEARCH METHODS + DESCRIPTIVE STATS
Total questions: 130
Worksheet time: 5hrs 40mins

How many cities have temperatures between 70 degrees and 99 degrees?
44
34
26
62

How many students have more than 1,000 songs on their MP3 player?
5
16
10
4

How many students spent over 40 minutes but under 60 minutes studying?
22
30
8
5

How many people visited the cinema twice?
28
20
25
30

Isiah collects data from two different companies, each with four employees. The results of the study, based on each worker's age and salary, are listed in the tables above.
Which statement is true about these data?
The median salaries in both companies are greater than $37,000
The mean salary in company 1 is greater than the mean salary in company 2
The salary range in company 2 is greater than the salary range in company 1
The mean age of workers at company 1 is greater than the mean age of workers at company 2

Within what frequency range did most students pay for their textbooks?
(Hint: Be careful with scales)
88-99
100-109
110-119
120-129
The distribution of household incomes in a small town is strongly skewed to the right. The mean income is $42,000 and the standard deviation is $24,000. The Ames family’s household income is $60,000. The z-score for the Ames family’s income is
-0.75
0.3
0.75
0.86
None of these, because z-score cannot be used unless the distribution is Normal
Mensa International is a non-profit organization that accepts only people with IQ score within the top 2%. What level of IQ qualifies one to be a member of Mensa?
Given a mean of 75 and a standard deviation of 7, what percentage of scores are greater than 68?
34%
84%
95%
68%
If I tell you that you scored at the 55th percentile on your final exam, you would know:
55% of the class scored the same or worse than you did
You earned a 55% on the exam
You failed the exam
45% of the class scored worse than you did

On the math portion of the SAT, scores are roughly normal, with a mean of 500 and a standard deviation of 100. What percent of scores are above 400?
68%
81.5%
84%
99.7%

On the math portion of the SAT the scores are roughly normal with a mean of 500 and a standard deviation of 100. Between what two values do approximately 95% of scores lie?
500-600
200-800
300-700
500-800

This distribution is (a) so we should use the (b) as a measure of center and the (c) as a measure of variability.
25%
68%
95%
99.7%

Which statement(s) is/are true about the histogram?
The median is higher than the mean.
The median has a lower than the mean.
The graph is skewed right.
The graph is skewed left.

What is the standard deviation on this Normal Curve?
6
12
34
18
What does it mean to have a z-score of z=0 on a quiz?
It means you did better than zero people.
It means you scored the same grade as the average grade.
It means you earned a zero on the quiz.
It means the average score was a zero.

1. Which best describes the shaded part of this approximately normal distribution graph?
The distribution of household incomes in a small town is strongly skewed to the right. The mean income is $42,000 and the standard deviation is $24,000. The Ames family’s household income is $60,000. The z-score for the Ames family’s income is
-0.75
0.3
0.75
0.86
None of these, because z-score cannot be used unless the distribution is Normal
What percent of a normal distribution lies outside of ±3 standard deviations?
99.7%
.15%
.3%
100%

This data is normally distributed. What percent of the data is in the shaded region?
68%
95%
99.8%
50%

This data is normally distributed. What percent of the data is in the shaded region?
68%
32%
16%
50%


What percent is represented by the area between -2 and 0?
68%
34%
47.5%
95%

What percent is represented by the area between -1 and 2?
34%
68%
81.5%
95%

What percent is represented by the area between -2 and -1?
12%
13.5%
15.75%
34%
Which of the following is the mean for the data set: 4, 4, 5, 6, 7, 7, 7, 8, 15?
4
7
9

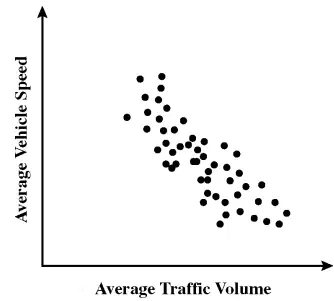
What kind of relationship?
Positive Correlation
Negative Correlation
No Relationship

What kind of relationship?
Positive Correlation
Negative Correlation
No Relationship
What is the purpose of randomization in experiments?
To manipulate the independent variable
To increase external validity
To minimize bias and increase validity
To control the dependent variable
What is the role of control variables in an experiment?
To manipulate the independent variable
To increase the external validity
To ensure the outcome is not altered
To control the dependent variable
True of False
The dependent variable is responsive to the independent variable.
True
False


What type of correlation does this scatterplot show?
Positive
Negative
No Correlation

Which day of the week had the lowest temperature?
Monday
Thursday
Tuesday
Wednesday

What is the independent variable in this graph?
Tadpoles
Year
Frogs
Number of tadpoles in the pond
What percentage does a whole pie chart represent?
360%
90%
50%
100%
What is a double-blind study?
A study that focuses on one or a few people
A study that compares multiple segments of a population at a single time
An experiment where both the researchers and participants are blind to group assignments
A tendency to ignore evidence that disproves ideas or beliefs

A scientist wants to study the effects of different quantities of Aspirin on the cold. Which is the independent variable?
The different quantities of Aspirin.
An improvement in the symptoms of the illness.

A scientist wants to see if birds prefer different colours of lights at night. She sets a lamp with a red bulb in her garden for one week, yellow for another week, blue for another week. She counts how many birds come into her garden every night for all three weeks. Which is the dependent variable?
The colour of the light bulbs.
The number of birds which come into the garden.

A scientist wants to understand if stress can affect memory. She tests this hypothesis by observing teachers teaching students quietly, peacefully, gently and other teachers teaching by shouting and getting angry. The students are tested and the results show that the students with the calm teachers got better grades. Which is the dependent variable?
The grades the students got.
The angry, shouting teachers.

A teacher wants to know if playing relaxing music during study time helps students study better. Every day for one week the teacher plays nice music to the students, then gives them a test. Next week the students study without music then do a test. The grades from the first week are 10% higher than the grades from the second week. What is the independent variable?
The music (or lack of) during study time.
The grades of the two tests.
David measures how many inches his tomato plant grows every week.
IV: (a)
DV: (b)

Examine each scatterplot and identify each as showing a positive correlation, a negative correlation or no correlation.
postive correlation
negative correlation
no correlation
Examine the scatterplot below and identify it as showing a positive correlation, a negative correlation or no correlation.
positive correlation
negative correlation
no correlation
Match the following
r = 0.17
weak positive
r = - 0.62
moderate negative
r = 0.91
strong positive
r = - 0.88
strong negative
r = - 0.25
weak negative

Records of sales of umbrellas and amount of rainfall suggests that there is a strong positive relationship between the two variables. What do you think about the situation in terms of explanatory and response variables?
Amount of sales of umbrellas is an explanatory variable.
Amount of rainfall is an explanatory variable
The connection between the variables is not clear
The two variables are independent of each other.

We wish to investigate the relationship between the time spent shopping and the number of items bought. The response variable (RV) is
The number of items bought
The number of items at the shop
The time spent shopping
The time spent getting to the shops
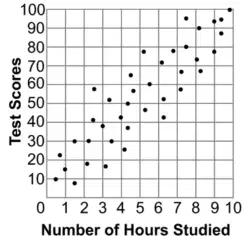
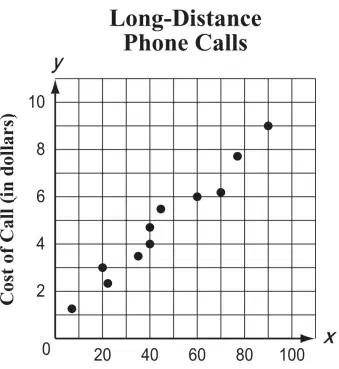
Match the following scatterplots to their descriptions.
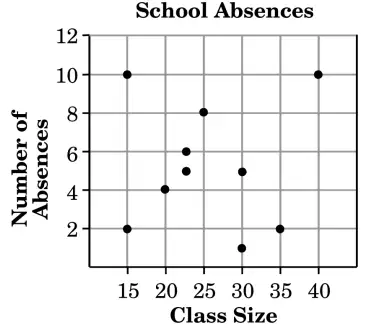
No association
Moderate positive linear association
Strong positive linear association
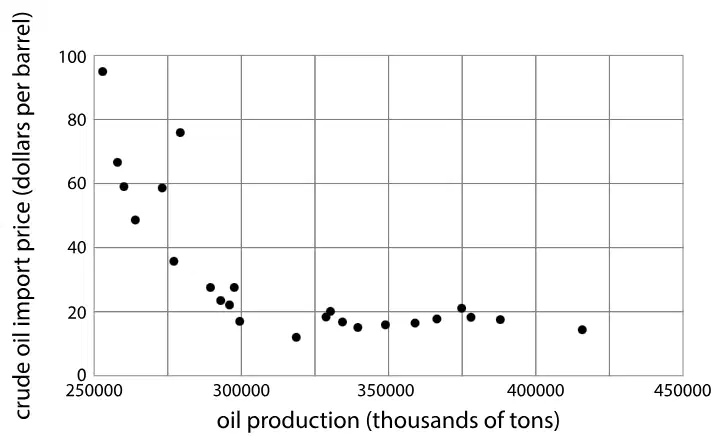
Strong negative non-linear association
Moderate negative linear association
A math teacher observed that as the number of hours students studied their multiplication facts increased, the number of errors the students made on their multiplication tests decreased. Which scatterplot could support this teacher's observation?



Estimate the correlation coefficient
r = 1
r = -1
r ≈ -0.8
r ≈ 0.8
r ≈ -0.5
All of the below sets have the same mean.
Set 1-Standard Deviation=3.1
Set 2-Standard Deviation=4.9
Set 3-Standard Deviation=1.7
Set 4-Standard Deviation=3.2
Which set of data probably has the points closest to the mean?
1
2
3
4


What is the most used number in a data set?
mean
median
mode
maximum
The hypothesis that two groups are the same.
Alternative hypothesis
Experimental hypothesis
Null hypothesis
Statistical hypothesis
Which of the following is NOT a null hypothesis?
Cats are no smarter than dogs
Americans enjoy hot dogs twice as much as hamburgers
There is no difference in test scores of students who drink coffee and those that don't
Students spend as much time on TikTok as on Instagram
p = 0.0203
Reject the null hypothesis
Fail to reject the null hypothesis
p = 0.0203
Reject the null hypothesis
Fail to reject the null hypothesis
How likely it is to get a result like the observed result if the null hypothesis is true.
Alternative hypothesis
Chi-squared value
Critical value
p-value

The image displayed would be considered what type of distribution?
Skewed Left
Skewed Right
Symmetrical
Outlier
T - tests compare the mean difference between how many means?
0
1
2
More than 2
If I concluded that I received a p value of .01; however, I mistakenly Failed to reject the null hypothesis, what type of error have I conducted?
Type l Error
Type 2 Error
Type 3 Error
Type 4 Error
Type 1 error occurs when?
a) We reject H0 if it is True
b) We reject H0 if it is False
c) We accept H0 if it is True
d) We accept H0 if it is False
Alternative hypothesis also called as
Null Hypothesis
Composite Hypothesis
Researchers Hypothesis
Simple Hypothesis
The null hypothesis is represented by:
Ha
Ho
t*
HP
μ
Data which can be ranked from smallest to largest
Nominal
Ordinal
Interval
Ratio
The "p" in p-value stand for:
Population
Probability
Popularity
Popcorn
Which symbol represents the mean of a sample?
μ
x
σ
s
What is the lowest recommended confidence interval one should use to predict the population mean?
90%
95%
50%
any percentage is fine
What are two examples of inferential statistics?
Range and percentiles.
Mean and probability distributions.
Regression analysis and hypothesis testing.
Variance and correlation.
The difference between the highest and lowest scores in a distribution.
standard deviation
variance
range
dependent variable
Which of the following best describes a Type I error?
The null is true, but we mistakenly reject it.
The null is false and we reject it.
The null is false, but we fail to reject it.
The null is true but we fail to reject it.
The null is true, and we fail to reject it.
The null hypothesis is represented by:
Ha
Ho
t*
HP
μ

What two factors are said to be violated to be considered non parametric?
mean
idependence
randomness
variance
If the Critical region is evenly distributed then the test is referred as?
a) Two tailed
b) One tailed
c) Three tailed
d) Zero tailed
Converting multiple data source into a single unified schema is known as
preprocessing
data reduction
data integration
data regression
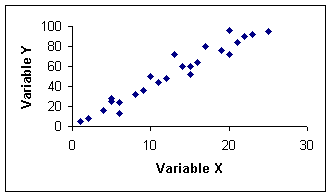


1. For a certain class, the relationship between the amount of time spent studying and the test grade earned was examined. It was determined that as the amount of time they studied increased, so did their grades. This is a positive association.
True
False
What are two examples of inferential statistics?
Range and percentiles.
Mean and probability distributions.
Regression analysis and hypothesis testing.
Variance and correlation.
If we select 100 persons from 25,000 registered voters and question them about candidates and issues, the 100 persons are referred to as the population.
True
False
I. Make a decision
II. State the hypotheses
III. Select the alpha level
IV. Locate the critical region
V. Compute the test statistic
I. Infinite scores
II. Manipulating sample size
III. Single or multiple extreme values
IV. The range that changes unpredictably from sample to sample
Income of a family is an example of
Quantitative data
Qualitative data
Saving

You randomly select two students from each classroom
stratified sample
convenience sample
systematic sample
cluster sample

How many drivers were interviewed regarding their preferred vehicle?
156
240
84
180

What percent of the drivers interviewed are female?
70%
80%
75%
65%
Linear regression analysis produces an equation of Y = 7 - 3.2X. This indicates that:
An X value of 0 would would increase Y by 7.
A 1 unit decrease in X results in a 3.2 unit decrease in Y.
A 1 unit increase in X results in a 3.2 unit increase in Y.
A 1 unit increase in X results in a 3.2 unit decrease in Y.
A regression model in which more than one independent variable is used to predict the dependent variable is called as _________.
a simple linear regression model
a multiple regression model
an independent model
What is a Type II error?
Failing to reject a null hypothesis when it is true
Rejecting a null hypothesis when it is true
Failing to reject a false null hypothesis
Rejecting a null hypothesis when there are differences between the two groups
What is the z-score for a data value that is below the mean by 2 standard deviations?
+2.00
-2.00
+1.25
-1.00
z-scores are the standardized scores for any data that is Normal.
True
Sometimes true, sometimes false
False
Jake took the ACT and Marlena took the SAT. Jake's z-score was 1.2 and Marlena's z-score was 1.4. Who did better on their test?
Jake
Marlena
They did the same.
It depends on the test.
Jake took the ACT and Marlena took the SAT. Jake's z-score was 1.2 and Marlena's z-score was 1.4. Which is true for both Jake and Marlena?
They scored higher than the mean.
They scored lower than the mean.
They did the same.
It depends on the test.
Why do we use z-scores?
To compare data values that have different numerical scales.
To compare similar data values.
To compare different data values on the same numerical scale.
Find the percent under the standard normal curve that lies to the right of z=-0.67.
Hint: find the value in the z-score table and convert to %
63.42%
74.86%
25.14%
50%
IQ tests have a mean of 100 and SD of 16. Einstein's IQ was 160. What is the z-score of his IQ?
1.75
3.75
0.75
2.75
Which of the following shows a z-score, corresponding to one standard deviation below the mean?
1
0
-1
-1.5
Which of the following best describes a type II error?
The null is true, but we mistakenly reject it.
The null is false and we reject it.
The null is false, but we fail to reject it.
The null is true but we fail to reject it.
Te null is false, and we reject it.
If your p-value is less than 0.05, what do you do to your null hypothesis?
You fail to reject the null hypothesis
The null hypothesis is factually correct
My null hypothesis is wrong
If I get a p-value score of 0.02, what does this mean? What should I do to my null hypothesis?
There is a 2% probability that my results happened by chance. I reject my null hypothesis and can say that my results are statistically significant.
There is a 20% probability that the difference in my results happened by chance. I fail to reject my null hypothesis and can say that my results are statistically significant.
There is a 2% probability that the difference in my results happened by chance. I reject my null hypothesis and can say that my results are statistically significant.
There is a 2% probability that the difference in my results happened by chance. I fail to reject my null hypothesis and can say that my results are not statistically significant.


The histograms represent the distributions of student-to-teacher ratios at many randomly selected private and public colleges in the United States. Select the most accurate comparison.
There is a larger proportion of private schools in the study with a low student-to-teacher ratio than there is for public schools.
There is a larger proportion of public schools in the study with a low student-to-teacher ratio than there is for private schools.
The proportion of schools with low student-to-teacher ratios is roughly the same in both distributions.
The histograms represent the distributions of student-to-teacher ratios at many randomly selected private and public colleges in the United States. Select the most accurate comparison.
There is more variability in student-to-teacher ratios at private schools in this study than there is at public schools in this study.
There is more variability in student-to-teacher ratios at public schools in this study than there is at private schools in this study.
Variability in student-to-teacher ratios is the same or similar at private and public schools in this study.

The shape of the distribution shown is best
classified as
The distribution is skewed right because the left tail is longer than the right tail
The distribution is skewed left because the right tail is longer than the left tail.
The distribution is skewed left because the left tail is longer than the right tail.
The distribution is skewed right because the right tail is longer than the left tail
The distribution is because
.
symmetric the left and right sides are approximately
mirror images

Observe the frequency distribution:
Estimate the relative frequency of the fourth class.
69
5.3
0.189 or 18.9%
0.54 or 54%

