
 Worksheets
analyzing graphs plenary
Total questions: 6
Worksheet time: 3mins
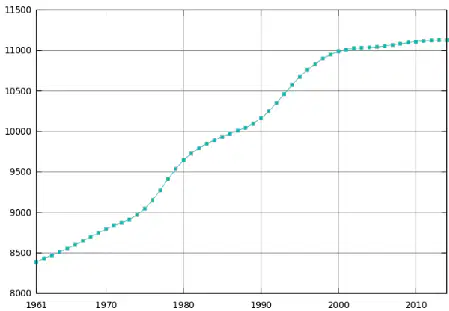
from year 1961 to 2000 the population _____
maintained the same level
dropped significantly
grew significantly
fell gradually
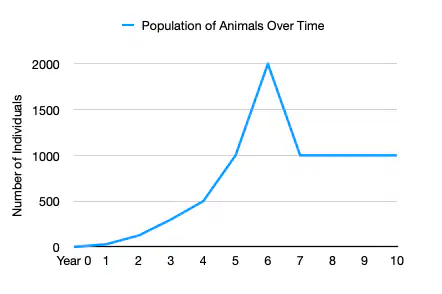
at which year the resources are abundant (more available) for animals population?
4
6
7
2
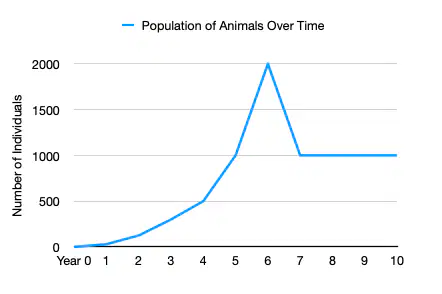
what caused the animals population to decline sharply from year 6 to 7? (select all that apply)
plenty of resources such as water and food
Human activities such as deforestation or hunting may have contributed to the decline.
Predation by one type of predators could have led to the sharp decrease in population.
Natural disasters such as floods or droughts could have caused the decline.
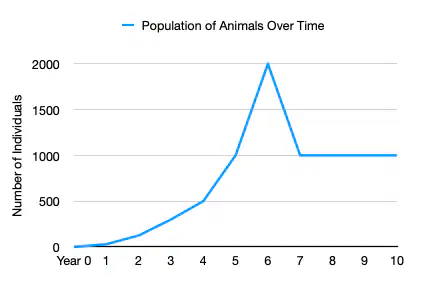
which describes the animals population after year 7?
rises gradually
goes down slightly
rockets steeply
remains constant
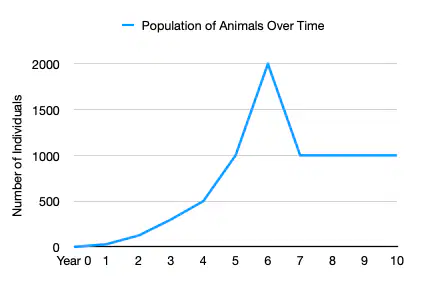
At year 5 the animals population was _
500
1000
1500
2000
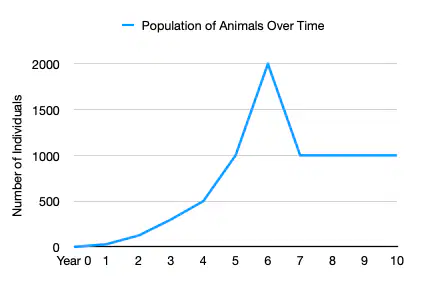
How are the resources available for the animals population in year 3 compared to year 4?
more
less
the same
not specific

