
 Worksheets
Statistics Review
Total questions: 24
Worksheet time: 44mins
What is the 1st Step to Find the "Line of Best Fit"?
(a)
What is the Desmos Formula to Calculate the "Line of Best Fit"?
(a)
What is the "Line of Best Fit". Round "m" and "b" to the nearest tenth.
y=0.8x+16.2
y=16.2x+0.8
y=0.6x+0.8
y=0.8x+0.6
A baseball coach graphs some data and finds the line of best fit. The equation for the line of best fit is y = 0.32x – 20.51
x = number of times at bat
y = number of hits.
How many hits should he expect from a player who is at bat 350 times (round to the nearest whole number)?
91 Hits
1158 Hits
11,180 Hits
35 Hits
The graph above shows a line of best fit for data collected on the amount of water bills in relation to the number of gallons of water used. What is the equation of the line of best fit?
y=41x + 449
y=−41x+449
y=40007x+449
y=−40007x+449
Classify the given scatter plots as one that has a positive trend, a negative trend, or no trend.
Positive Trend
No Trend
Negative Trend
Classify the given scatter plots as one that has a positive trend, a negative trend, or no trend.
Positive Trend
No Trend
Negative Trend
Classify the given scatter plots as one that has a positive trend, a negative trend, or no trend.
Positive Trend
Negative Trend
No Trend
Alton studies the growth patterns of sassafras trees and yellow birch trees in the 88 counties in Ohio. He finds that
Approximately 27% of the counties have both species of trees,
yellow birch only grows in 24 counties, and
1 out of 11 counties grows neither species.
Complete the table to show the relationship between the number of counties where sassafras trees and yellow birch trees grow.
88
64
24
8
8
24
56
80
0
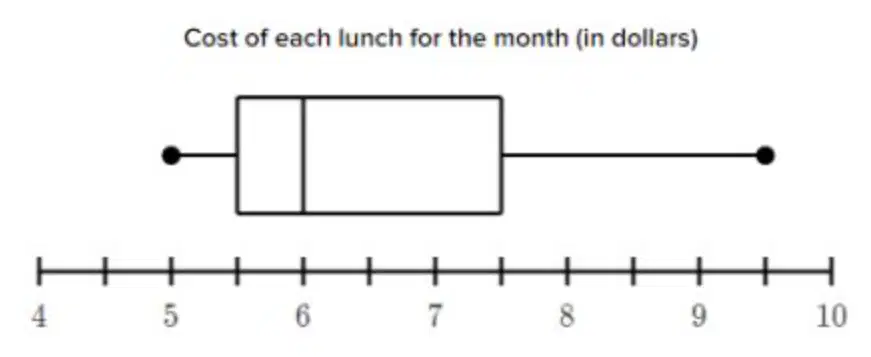
Use the box plot below to fill in the blanks to the five-number summary below.
Minimum (a)
Maximum (b)
Median (c)
First Quartile (d)
Third Quartile (e)
How would you type a Data Set into Desmos? Use Data Set: 4, 7, 2, 9 in your answer.
(a)
How do we calculate the Mean in Desmos:
(a)
How do we calculate the Median in Desmos:
(a)
How do we calculate the Maximum in Desmos:
(a)
How do we calculate the Minimum in Desmos:
(a)
How do we calculate the Range in Desmos:
(a)
How do we calculate the Quartile 1 in Desmos:
(a)
How do we calculate the Quartile 3 in Desmos:
(a)
How do we calculate the Interquartile Range in Desmos:
(a)
How do we calculate the Standard Deviation in Desmos:
(a)
Label the Mean, Median, and Mode of the Graph.
Label what type of Skewness?
Positive (Right) Skew
Negative (Left) Skew
Median, Mean, Mode
Zero (Normal) Skew
Label the Mean, Median, and Mode of the Graph.
Label what type of Skewness?
Mode
Mean
Positive (Right) Skew
Negative (Left) Skew
Median
Zero (Normal) Skew
Label the Mean, Median, and Mode of the Graph.
Label what type of Skewness?
Mode
Mean
Positive (Right) Skew
Negative (Left) Skew
Median
Zero (Normal) Skew
Calculate the following using the data set: 82,23,59,94,70
Mean: (a)
Median: (b)
Range: (c)
Interquartile Range (IQR): (d)
Standard Deviation: (e)

