
 Worksheets
Unit 3 Study Guide
Total questions: 60
Worksheet time: 4hrs 50mins


Which runner stopped for a rest?
Albert
Bob
Charlie


What is a plausible story for this graph?
A student was jogging from school to home. She stopped to tie her shoe and take a drink from her water bottle, then continued at the same pace as before.
A student was jogging from school to home. She walked for a while, then continued jogging.
A sled rider was going down a hill. The hill was steep at first, then kind of flat. At the end, it was steep again.
A car was slowing down, then contued moving at a constant rate. Finally, it slowed to a stop,
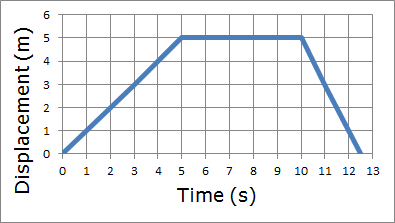
Which of these graphs do not show the object staying still?


What is a plausible description of this graph?
The object began moving away quickly at a constant speed. It stopped. It then turned to return at a constant speed.
The object changed diections three times.
The object began walking away slowly then began running away. Both were at constant speeds. It then turned and walked back to where it started.
The object began moving away at a constant speed. It continued moving away, but slowed its speed. It then turned around and returned home at a speed that was probably in between the first two speeds.
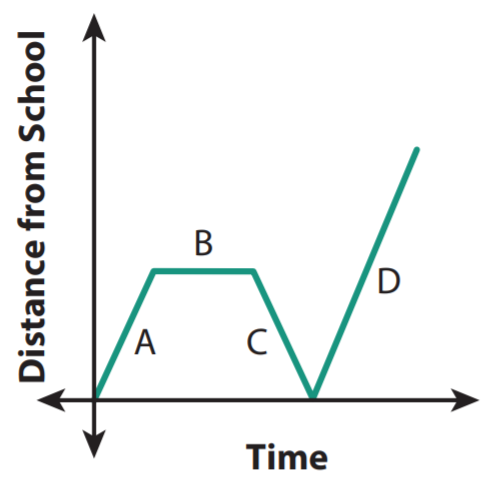
The graph shows Timmy's distance he is as he leaves school one afternoon. What happens in section C? Why is the distance from school decreasing?
Timmy is walking back to school because he forgot his math book.
Timmy is talking to a friend and not walking.
Timmy is walking faster home.
Timmy is dancing in the street.

Between 4 and 8 seconds the helicopter's distance is .....................
Increasing
Decreasing
Staying the same


The graph shows Timmy's distance he is as he leaves school one afternoon. What happens in section B?
Timmy is walking back to school because he forgot his math book.
Timmy is talking to a friend and not walking.
Timmy is walking faster home.
Timmy is dancing in the street.
Which graph (if any) shows the object moving at a constant speed, stopping, and then continuing to movie in the same direction?


none of these

The graph shows the speed of Mr. Sam driving to work. Which section shows Mr. Sam stopped in traffic?
a.
b.
g.
d.
f.
The graph shows the speed of Mr. Sam driving to work. Which section shows Mr. Sam driving on the interstate?
a. - his rate of change is the steepest
b. - he's going the fastest here
g. - steep rate of change and not for a long time
d. - shortest amount of time
f. - he's going fast here
The graph shows Timmy's distance he is as he leaves school one afternoon. What happens in section D?
Timmy is walking back to school because he forgot his math book.
Timmy is talking to a friend and not walking.
Timmy is walking all the way home.
Timmy is dancing in the street.
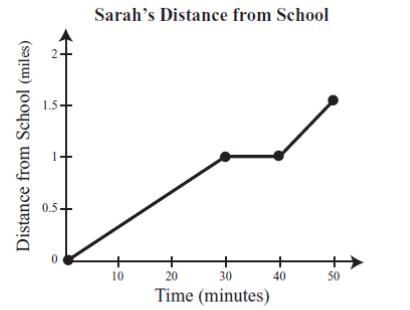




What type of correlation does this graph have?
positive
negative
none
all of the above

Which sentence describes the relationship shown on this scatter plot?
As the temperature decreases, the visitors increase.
As the temperature increases, the number of visitors increases.
As the visitors increase, the temperature decreases.
No correlation

What type of correlation does this scatter plot show?
positive
negative
no correlation
nonlinear association

Describe the correlation in the graph shown.
Strong Negative
Strong Positive
Weak Negative
Weak Positive

Which scatter plot show a positive relationship?
Graph A
Graph B
Graph C
Graph D


Name the type of association.
no association
nonlinear association
positive associtation
negative association
scatter association

Name the type of association.
no association
nonlinear association
positive associtation
negative association
scatter association

Name the type of association.
no association
nonlinear association
positive associtation
negative association
negipositive association

Name the type of association.
no association
nonlinear association
positive associtation
negative association
scatter association

Which scatter plot has a stronger association?
Scatter Plot A because the points are closer together.
Scatter Plot B because the points are further apart.
Which scatter plot appears to be linear?
Scatter Plot A
Scatter Plot B
Which is a true statement about two numerical sets of data that have negative association?
A. As one variable increases, the other variable does not change.
B. As one variable increases, the other variable increases.
C. As one variable decreases, the other variable decreases.
D. As one variable increases, the other variable decreases.
What kind of correlation exists if as x increases, y increases

Interpret the meaning of the slope of the graph below.
$2 for every 1 mile driven
$1 for every 2 miles driven
2 miles driven for $1
1 mile driven for $2

Interpret the meaning of the slope in the graph below.
2 cm of rainfall per hour
1/4 cm of rainfall per hour
1/2 cm of rainfall per hour
4 cm of rainfall per hour

Charlie rented a moving truck. He paid a daily fee plus a per-mile fee to rent the truck. The equation below represents the daily amount Charlie paid for the truck if he drives it x miles.
y=0.5x+10
What does the slope of the graph of this equation represent?
$0.5 per day
$0.5 for each mile driven
How much charlie paid for the Truck
0.5 miles each day

The table represents a used car salesman's monthly salary including commission made on the sale of cars. What is the slope and what does it represent?
The slope is $850 per car and it represents the commission per car sold.
The slope is $425 per car and it represents the commission per car sold.
The slope is $1500 and it represents the monthly salary before commission.
The slope is $850 and it represents the monthly salary before commission.

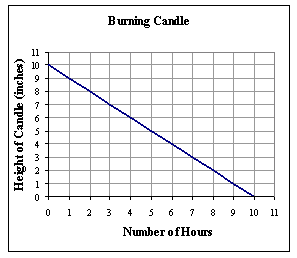

What does the slope mean in the context of the problem?
The cost will increase by $1.40 per topping
The cost will decrease by $1.40 per topping
The cost will increase by $1.90 per topping
The cost will decrease by $1.90 per topping

Janice is saving money for retirement. The equation y = 500x + 12,000 models her retirement savings where y is the total she has saved in dollars, and x is the number of months.
Interpret the y-intercept.
Janice started with $500 in her account
Janice started with $12,000 in her account
Each month, Janice saves an additional $500
Each month, Janice saves an additional $12,000
Janice is saving money for retirement. The equation y = 500x + 12,000 models her retirement savings where y is the total she has saved in dollars, and x is the number of months.
Interpret the slope.
Janice saves $12,000 every 500 months
Janice saves $500 every 12,000 months
Each month, Janice saves an additional $500
Each month, Janice saves an additional $12,000
y=0.5x+10
What does the slope of the graph of this equation represent?

An air conditioning saleman earns a base salary plus a commission for each air conditioner her sells. The equation y = 375 + 125x represents his pay based on the number of air conditioners he sells each week. What is the slope and what does it represent?
The slope is 375 and represents the amount he earns for each air conditioner.
The slope is 125 and represents the amount he earns for each air conditioner.
The slope is 375 and represents the base salary.
The slope is 125 and represents the base salary.

