
 Worksheets
Unit 4 Assessment Part II
Total questions: 10
Worksheet time: 25mins

Which domain and range best describes the following graph?
Domain : all real numbers
Range: x > 1
Range: all real numbers
Domain: x ≥ -1
Domain: all real numbers
Range: y ≤ 1
Range: all real numbers
Domain: y > 1
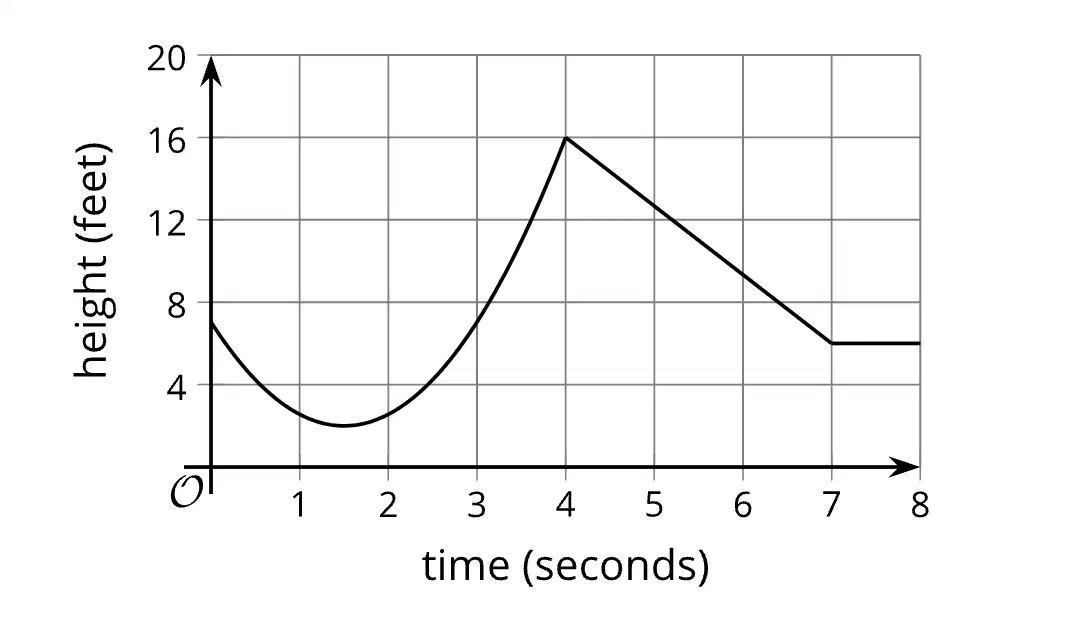
Using the graph, select which of the following statements are true:
x-intercept: (0,7)
maximum value: 16
y-intercept: (0,7)
minimum value: 16
The graph of f(x) = | x -3| has shifted from its original graph of f|x|. Which transformation describes this transformation?
Graph translated to the right 3 units
Graph translated to the down 3 units
Graph translated to the left 3 units
Graph translated to the up 3 units
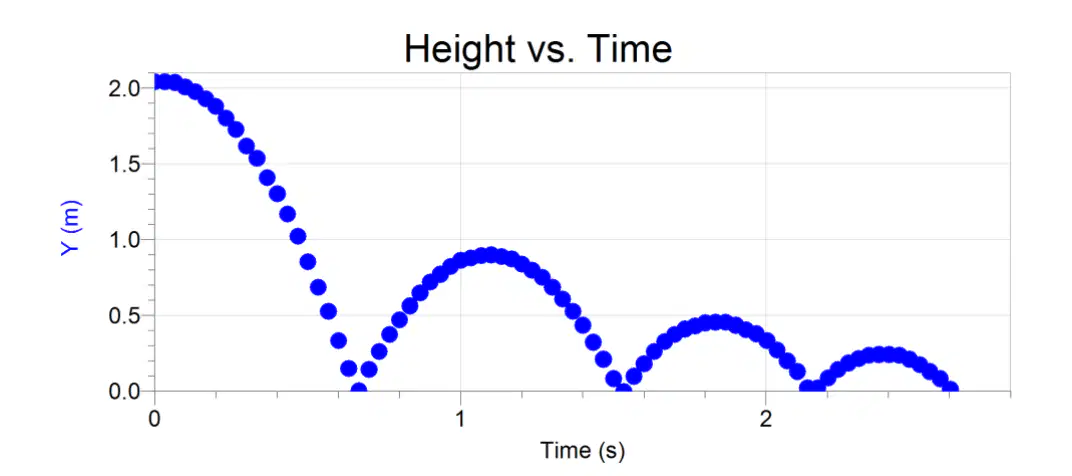
Using the graph of the data of a bouncing ball, determine f(1):
.5
.8
0
1.5
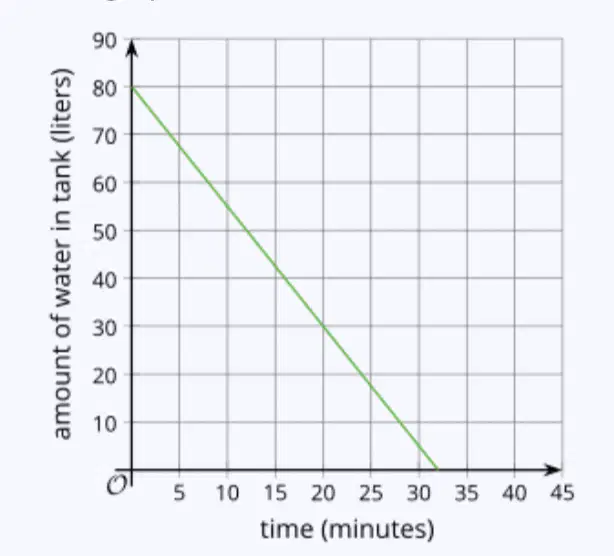
A tank contained some water. The function w represents the relationship between t, time in minutes, and the amount of water in the tank in liters. Using the graph determine when w(t)= 0
t=16
t=80
t=0
t=32

A tank contained some water. The function w represents the relationship between t time in minutes and the amount of water in the tank in liters. Determine w(20):
30 Liters
15 Liters
25 Liters
50 Liters
Tyler walks to school. The function D gives his distance from school, in meters, t minutes since he left home.
Which equation tells us “Tyler is 200 meters from school after 15 minutes”?
t(15)=200
t(200)=15
D(200)=15
D(15)=200
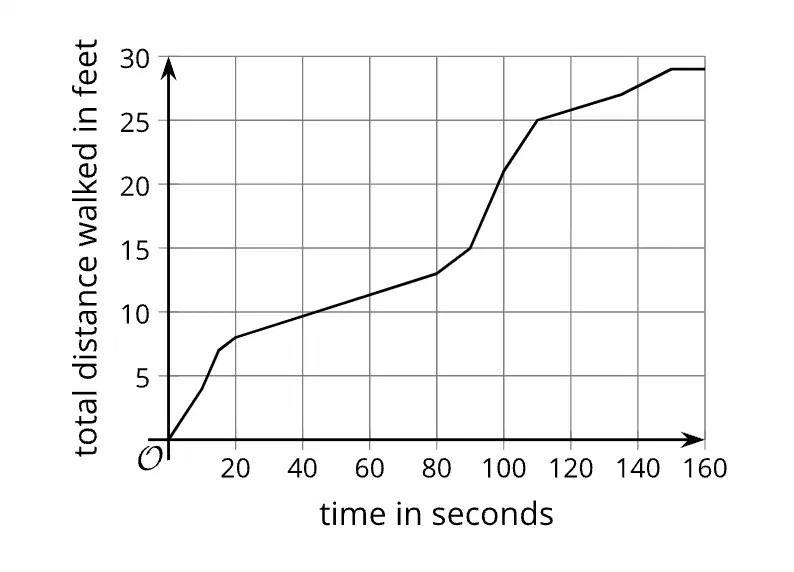
The graph shows the total distance, in feet, walked by a person as a function of time, in seconds. What was the average rate of change between 40 seconds and 90 seconds?
1 feet/sec
.5 feet/second
.5 feet/minute
.1 feet/second
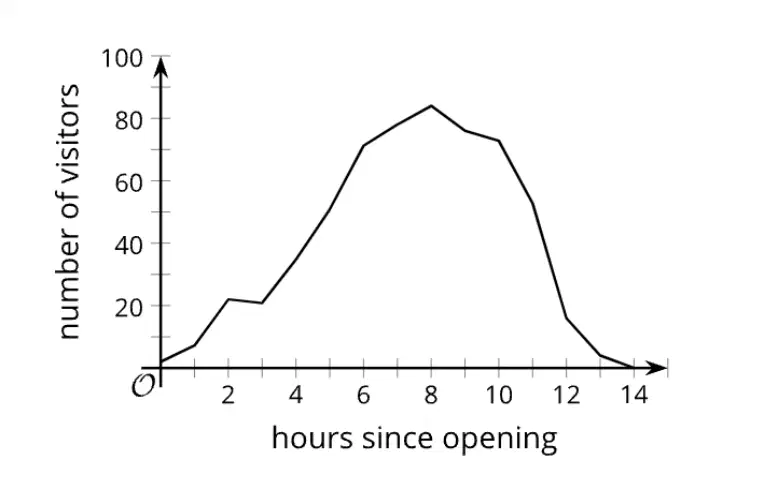
The following graph represents the number of visitors to an art exhibition. Determine the correct domain and range.
D: all real numbers
R: 0 < y < 14
D: 0 ≤ x ≤ 14
R: 0 ≤ y ≤ 86
D: 0 > x > 14
R: 0 > y > 86
D: 0 ≤ y ≤ 14
R: 0 ≤ x ≤ 86
Evaluate f(-2) if f(x) = -x2+ 3
7
-1
4
1

