
Font size
 Worksheets
EMT211 Probability and Statistics for Engineering
Total questions: 20
Worksheet time: 1hrs 13mins
If x is temperature and y is coffee sales, use the following formula to determine the coffee sales on a 14°C day (answer in RM).
y = -60x+6443
RM 5603
RM 5673
RM 5303
RM 5301


A restaurant sells pizza for the prices in the data table. Calculate the linear regression equation of the data.
y = 1.5x + 12
y = 12x + 1.5
y = 0.67x - 8
y = -8x + 0.67

What is a best-fit line used for? Select ALL that is relevant (more than one answer is applied).
To make predictions by regression and corelate the data
To plot the graph for visual impact and decision making
To connect the points for easy interpretation (deduce) and interpolation
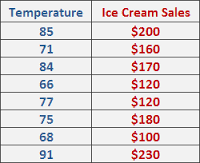
Find the equation of the line of best fit for the given data
y = 163.41x+1.49
y =- 163.41x+ 4.19
y =- 4.19x+163.41
y = 4.19x -163.41

Write the linear regression equation for the following data points. Round to the nearest tenth.
y=−0.27x+3.93
y=3.93x+−0.27
y=1.25x+3.75
y=0.27x+3.94
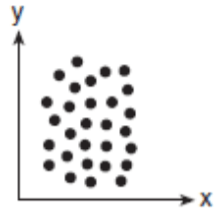
Which scatter plot diagram shows the strongest positive correlation?
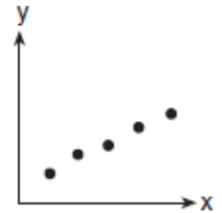
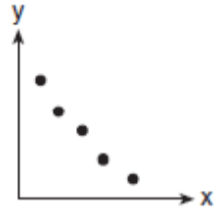
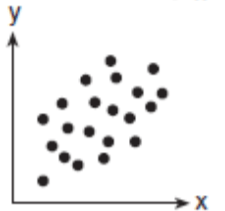

The annual profits for a company are given in the following table, where x represents the number of years since 1992, and y represents the profit in thousands of dollars. Write the linear regression equation that represents this set of data, rounding all coefficients to the nearest hundredth. Using this equation, estimate the year in which the profits would reach 378 thousand dollars.
2029
2014
2003
8753
A study showed a positive relationship to the sound level of listening to music and hearing loss. Is this association or causation?
Association
Causation
Neither
A study showed a positive relationship between students owning a cell phone and driving a car to school. Is this association or causation?
Association
Causation
Neither


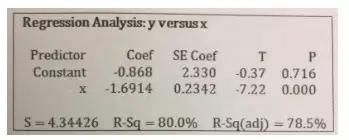
Given the following Minitab output, which of the following is false?
80% of the variability in y is explained by the linear relationship with x.
Since r=0.898, the linear relationship between x and y is strong, positive, and linear.
As x increases by one unit, y decreases, on average, by 1.6914 units.
The intercept of the least squares regression line is -0.868.
The equation of the least squares regression line is y=-0.868-1.6914x.
A linear relationship between the amount of saturated fat in a sandwich and the amount of calories in a sandwich was determined. A least squares line was fit using some data collected by nutritionists, resulting in the equation y=217.3+35.2x where x is saturated fat grams and y is caloric content. What is the estimated caloric content of a sandwich with 8 grams of saturated fat?
35.2 calories
217.3 calories
281.6 calories
498.9 calories
1738.4 calories

The linear regression equation is y = 61.93x - 1.79. Use the equation to predict how far this person will travel after 10 hours of driving.
716.5 miles
517.6 miles
617.5 miles
671.5 miles
176.5 miles

The linear regression equation for the data is y = 1.5x + 12. Interpret the slope of the equation.
The slope is (0, 1.5). It means that a pizza with 0 toppings will cost $1.50.
There are 1.5 toppings.
The slope is 1.5. It means that it costs $1.50 per topping.
There are 1.5 pizzas.
The intercept when no topping is at $15.

Which variables are most likely negatively correlated with screen time? Select ALL(more than one answers) that apply.
Amount of text answered.
Amount of time asleep.
Amount of time playing video games.
Amount of time playing sports.
Suppose a certain scale is not calibrated correctly, and as a result, the mass of any object is displayed as 0.75 kilogram less than its actual mass. What is the correlation between the actual masses of a set of objects and the respective masses of the same set of objects displayed by the scale?
-1
-0.75
0.75
1
0

