
 Worksheets
Scatter Plots Correlations
Total questions: 53
Worksheet time: 41mins

What type of association does this graph have?
Positive
Negative
None
All of the above

Use the trend line to predict how many chapters would be in a book with 180 pages.
12 chapters
15 chapters
18 chapters
21 chapters
THERE'S NO PICTURE, READ THE QUESTION: What type of correlation exists between the outside temperature and the amount of layers you wear?
Positive correlation
Negative correlation
No correlation
All of the above
The correlation between the number of siblings you have and your weight.
Positive correlation
Negative correlation
No correlation
All of the above

Which correlation is this?
Negative correlation
No correlation
Positive correlation
None of the above


y = x + 19
What is the line of best fit used for?
To make predictions
To make the graph look pretty
To connect the points
To make it look like you know what you are doing

Based on this scatterplot, a student with 12 absences should get approximately what score on the final exam?
60
92
70
76

Which sentence describes the relationship shown on this scatter plot?
As the temperature decreases, the visitors increase.
As the temperature increases, the number of visitors increases.
As the visitors increase, the temperature decreases.
No correlation

Based on this scatterplot, a student with 6 absences should get approximately what score on the final exam?
88
96
65
75

Based on the graph, if Joe earned $400, how many hours did he work?
25 hours
35 hours
45 hours
15 hours

Which of the following would be a reasonable approximation for the length of time it would take for her to run 6 miles?
A. 50 min
B. 80 min
C. 45 min
D. 60 min

Based on the scatterplot, which of the following conclusions about the relationship between height and weight is true?
There is a negative relationship between height and weight.
There is a positive relationship between height and weight.
There is a constant relationship between height and weight.
There is no relationship between height and weight.

What is the correlation between the length of a running start and the distance of a jump?
Positive: The further you run, the further you jump
Negative: The less you run, the less distance you jump
Positive: The further your running start, the less your jump distance

Which statement best describes the line of best fit?
The more books students read, the lower their English grade.
The more books students read, the higher their English grade.
The fewer books students read, the higher their English grade.
No relationship exists between the number of books students read and their English grades.

Use the data to predict the growth that would occur if the temperature were 55ºF.
A correlation shows that two things are:
related in some way
causing each variable to happen
unrelated
Which implies that one variable has a direct effect on the other variable?
Correlation
Causation
Which example shows CAUSATION?
High social media usage and reduced grades.
A car ran out of gas and being stranded on the side of the road.
Long recess time and bad classroom behavior in elementary school.
Which example shows CORRELATION?
I ate a habanero pepper and my mouth feels like it is on fire.
Music lessons and brain development.
I stepped on a spider and it died.
Which example shows CAUSATION?
Stress level and desire for chocolate.
Eating more butter and buying more bread.
The longer you facetime, the less battery your phone has.
Which example shows CORRELATION?
I put water in the freezer and now I have ice.
The alarm clock went off and there was sound from the clock.
Temperature and the amount of people at Six Flags.
Which example shows CAUSATION?
Being happy makes you a better student.
Touching poison ivy and having itchy blisters on your hand.
Doing yoga and eating more ice cream.
Which example shows a correlation?
It rained and the ground is wet.
Water sales increase as temperature increases.
To graphically represent a correlation between two variables, construct a ___.
box & whisker diagram
histogram
normal curve
scatterplot
The correlation coefficient 'r' is a value between:
0 and 1
0 and 100
-1 and 1
-2 and 2

Describe the correlation.
Strong Negative
Strong Positive
Weak Negative
Weak Positive
What does the correlation coefficient (r-Value) tell us?
A perfect negative correlation has a correlation coefficient of ____.
1
-1
0
r = -0.89
Strong positive
Weak positive
Strong negative
Weak negative

Estimate the correlation coefficient for this scatterplot.
r = 1.2
r = 0.85
r = 0
r = -0.85
Which of the following represents the weakest negative correlation?
0
-0.34
-0.92
-0.57

Estimate the value of r:
0.83
0.05
-0.75
1

Estimate the value of r:
0.03
-1
0.79
-0.72
Which of the following represents the STRONGEST correlation?
-0.03
0.5
0.03
-0.99

Estimate the value of r:
-0.36
-0.83
0.99
0.72
Attendance & grades have an r-value of -0.93. This indicates a ______ correlation.
Strong positive
Weak positive
Strong negative
Weak negative

Describe the correlation in the graph shown.
A) Strong Negative
B) Strong Positive
C) Weak Negative
D) No Correlation

Estimate the correlation coefficient for this scatterplot.
A) r = -0.9
B) r = -0.1
C) r = 0.9
D) r = 1

Which is the line of best fit?
A) Black
B) Orange
C) Red
D) Blue
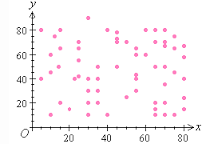
What type of correlation does this graph show?
A) Positive
B) negative
C) no correlation
D) all of the above
As x increases, y decreases.
A) no correlation
B) negative correlation
C) correlation coefficient
D) positive correlation
As x increases, y increases
A) correlation coefficient
B) causation
C) positive correlation
D) negative correlation
What type of correlation?
Ice cream sales and shark attacks.
A) Positive correlation
B) Negative correlation
C) No correlation

The scatter plot shows the number coffee shops in different cities and the number of violent crimes. Which of the following is NOT true?
A) As the number of coffee shops increase, violent crimes appears to increase.
B) The line of best fit shows a positive correlation.
C) The data has a positive correlation coefficient.
D) An increase in coffee shops causes an increase in violent crimes.

r=0.95

What does a correlation coefficient of 0 indicate?
Strong positive correlation
Strong negative correlation
No correlation
Weak correlation

