
 Worksheets
Math 1530 - Chapter 1 Vocab
Total questions: 50
Worksheet time: 27mins
Plural
Datum
Statistics
Data
Samples
Singular
Data
Sample
n
Datum
Population
An entire group of people/things under research.
A subset, or smaller portion of the population.
Is a special subset of cluster sampling.
A number that represents a property of the sample.
Convenience Sampling
Dividing the population into groups, and then randomly selecting some of the groups; all members from these chosen groups are in the [blank] sample; not representative.
Dividing the population into groups, and then taking your sample from a proportionate number from each group; Some of all, forced representation across all subgroups.
A type of sampling that is not random and involves using a population that is readily available; not representative.
Using a sample that is selected to match the population with some respect to some specific characteristics.
Sample
A subset, or smaller portion of the population.
An entire group of people/things under research.
A value of variables.
A number that represents a property of the sample.
Stratified Sampling
Dividing the population into groups, and then taking your sample from a proportionate number from each group; some of all.
Randomly selecting a starting point in a list of names and then taking every nth piece of data from a listing of the population.
A type of sampling that is not random and involves using a population that is readily available.
A special subset of [blank] sampling.
Cluster Sampling
Dividing the population into groups, and then taking your sample from a proportionate number from each group.
Not representative.
A type of sampling that is not random and involves using a population that is readily available.
Dividing the population into groups, and then taking your sample from a proportionate number from each group; not random sampling.
Systematic Sampling
Dividing the population into groups, and then randomly selecting some of the groups; all members from these chosen groups are in the [blank] sample.
Randomly selecting a starting point in a list of names and taking every nth piece of data from a listing of the population.
Sample left out large portions aka demographics of the population.
Sample such that every member of the population has an equal probability of being in the sample.
What are the types of random sampling?
Simple random (srs), convenience, undercoverage, stratified, cluster, systematic, and volunteer.
Volunteer, convenience, systematic, simple random (srs), cluster, and stratified.
Stratified, undercoverage, response, nonresponse, cluster, and volunteer.
Convenience, systematic, simple random (srs), cluster, and stratified.
Volunteer Sampling
Dividing the population into groups, and then randomly selecting some of the groups; all members from these chosen groups are in the [blank] sample.
Required for all medical experiments.
Randomly selecting a starting point in a list of names and taking every nth piece of data from a listing of the population.
Sample such that every member of the population has an equal probability of being in the sample.
Simple Random Sampling (SRS)
Randomly selecting a starting point in a list of names and taking every nth piece of data from a listing of the population.
Sample such that every member of the population has an equal probability of being in the sample.
Holy Grail of sampling. Sample such that every member of the population has an equal probability of being in the sample.
Sample left out large portions aka demographics of the population.
A number that is a property of the population.
Statistic.
Data
Datum
Parameter
Statistic
A value of variables
Average
A number that is a property of the population.
A number that represents a property of the sample.
When we measure every member of the population often *impossible/impractical.
Sample
Census
Parameter
Descriptive
Characteristics of the population.
Parameter
Statistics
Descriptive
Inferential
Characteristics of the same sample.
Estimated
Known
Statistics
Sample subset
n
Sample size
Population size
Sample Standard Deviation
Sample mean (aka average)
Population size:
N
n
p' (aka p̂)
x̄ aka x bar
Sample standard deviation:
S
p
n
s
Population Standard Deviation:
p
p'
σ aka small sigma
µ (aka small mu)
Population mean (aka average)
p
µ (aka small mu)
N
x̄ aka x bar
Sample Mean
p’ (aka p̂)
p'
p
x̄ aka x bar
Sample proportion:
p
p'
s
small mu
Population Proportion:
p
P
p'
Pµ
Standard Deviation
The mean.
The average of the data.
The measure of spread of data relative to the mean.
Is not inherently numerical
Categorical/Qualitative
Is not inherently numerical
Is inherently numerical
Measurable
Does not add up to 100%
Quantitative (choose multiple answers)
Is inherently numerical
Is not inherently numerical
Age
Discreet Data
Continuous (measurable) data
Pie chart (two correct answers):
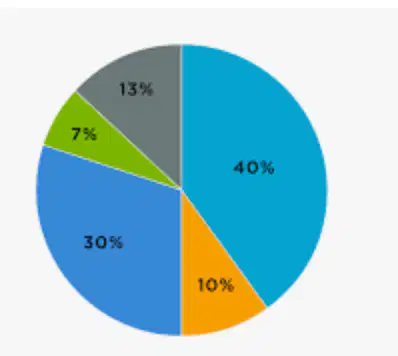
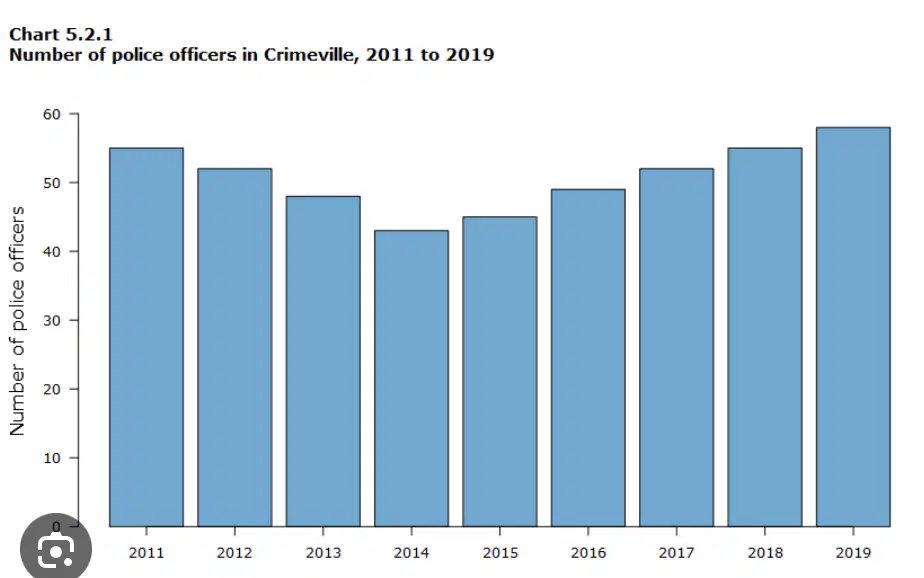
No sample size/percentages. Categories must add up to 100%
Bar chart (two correct answers):
Bar chart sorted from highest to lowest
Does not add up to 100%
Categories add up to 100%
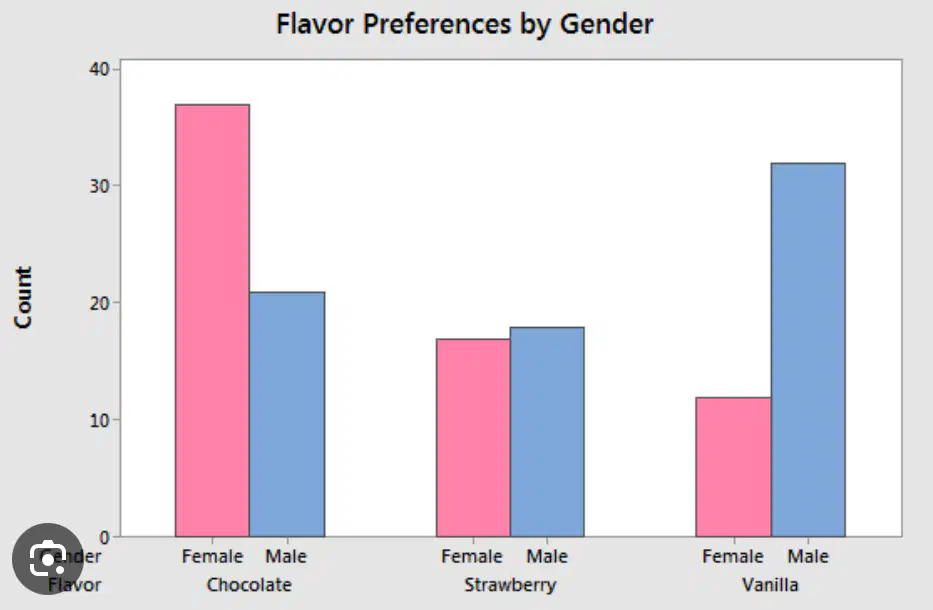
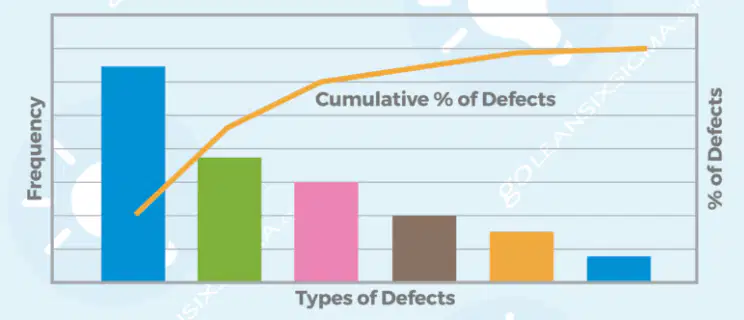
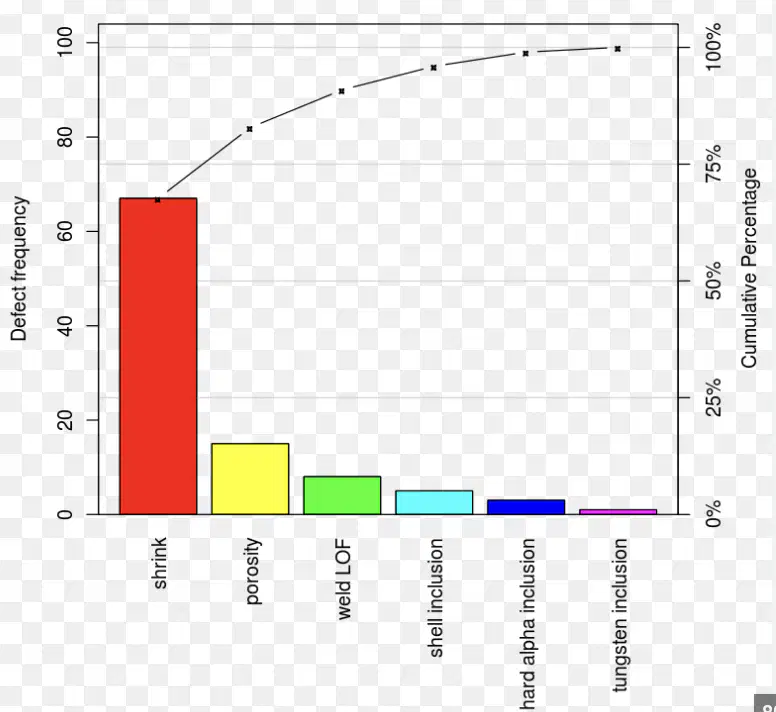
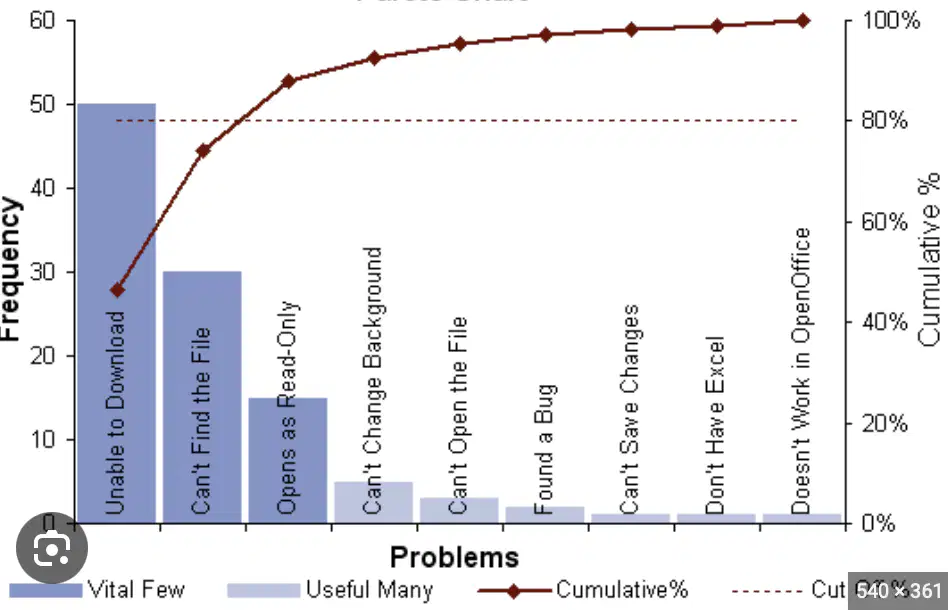
Pareto (two correct answers):
No sample size/percentages. Categories must add up to 100%
Does not add up to 100%
Bar chart sorted from highest to lowest bar
Explanatory variable:
Additional variables that can cloud a study's outcome; lies on x-axis.
Attempts to explain or influence changes in another variable; lies on x-axis.
The group set aside to receive the placebo treatment; lies on x-axis.
The affected variable, the variable that is changed by altering the [blank] variable; lies on y-axis.
Cofounding variables
Explanatory variable whose affects are so intertwined we cannot separate them.
Additional variables that can cloud a study's outcome.
One where both the subjects and the researchers are blinded.
Attempts to explain or influence changes in another variable.
Response Variable:
The affected variable, the variable that is changed by altering the [blank] variable; lies on y axis.
Additional variables that can cloud a study's outcome; lies on x-axis.
Different values of the [blank] variable; lies on x-axis.
Preventing either the subjects or the researchers from knowing wether they are assigned to the control group or the treatment group; lies on y-axis.
Double-blinding
Attempts to explain or influence changes in another variable.
The group set aside to receive the placebo treatment.
One where both the subjects and researchers are [blank].
Additional variables that can cloud a study's outcome.
Placebo Effect:
Different values of the [blank] variable.
Additional values that can cloud a study's outcome.
Preventing either the subjects or the researchers from knowing whether they are assigned to the control group or the treatment group.
The treatment that cannot influence the response variable.
Additional variables that can cloud a study's outcome.
Placebo effect.
Cofounding variables.
Lurking variables.
Double-blinding.
The result of categorizing or describing attributes of a population, usually described by words or letters.
Categorizing.
Categorical/Qualitative data.
Quantitative Data.
Discrete Data.
The result of counting or measuring attributes of a population, always described by numbers.
Quantitative/Numerical data.
Continuous Data.
Discrete Data.
Qualitative Data.
The ratio of the number of times a certain data values occurs in the set of the total number of data values.
Relative.
Ratio.
Relative Frequency Table.
Relative Frequency.
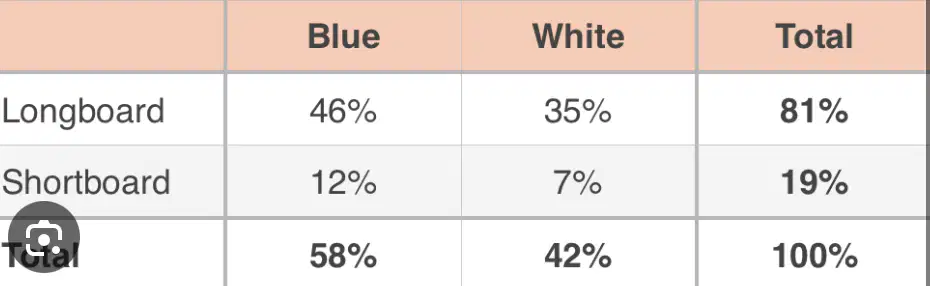
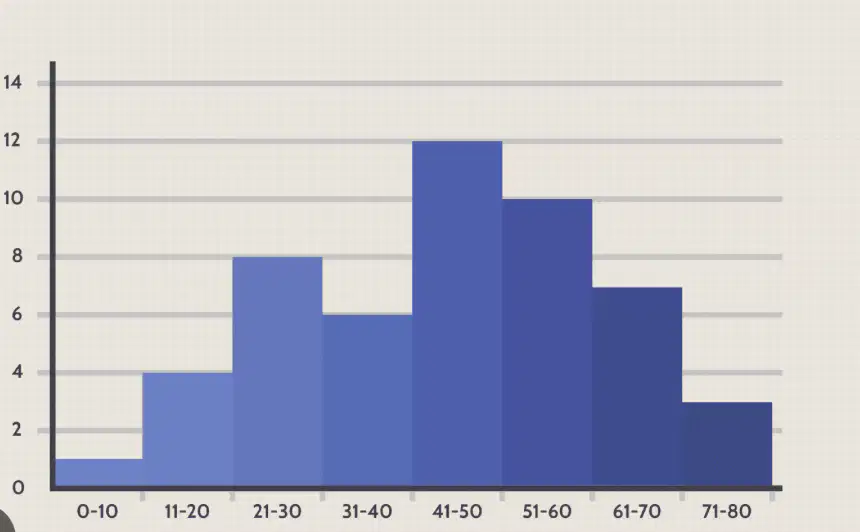
What is this an example of?
Histogram.
Relative Stability.
Relative Frequency Table.
Box chart.
True or False: Statistics are known which also means descriptive.
True
False
True or False: Parameters are known = descriptive.
False
True
True or false: Parameters are estimated = inferential.
False
True
Select the examples of continuous data.
Income
Money in pocket
Weight
Shoe size
Zip code
Select the examples of discrete data.
Number of children
Income
Money in pocket
Number of gumballs in a dish.
Age
Confusing questions, leading questions, order of questions can result in fudging answers based on perceived desired answer.
Non-response
Response Bias
Undercoverage Bias
Misleading Bias.
Not a random sample, not a representative samples. Sample left out large portions aka demographics of the population.
Undercoverage Sampling
Response Bias.
Undercoverage Bias.
Margin of error.
Missing a massive amount of data; only passionate people respond.
Non-response Bias.
Response Bias
Disproportionate Bias.
Undercoverage Bias.
True or false: Variance is similar to standard deviation.
True
False
True or false: Variance = σ2
False
True

