
Font size
 Worksheets
4.14 Graphs in Engineering Systems
Total questions: 20
Worksheet time: 18mins
What are graphs used for in engineering systems?
To represent historical events
To represent changes
To illustrate theoretical concepts without data
To provide entertainment
What does the trend shown by a graph indicate?
The complexity of the engineering system
The cost of materials used
What is happening in the system or process
The color preferences for engineering designs
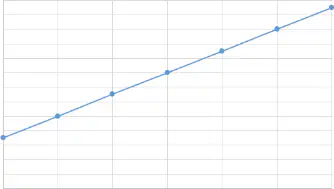
Identify the type of graph that shows a constant rate of change.
Linear
Trigonometric
Exponential
Logarithmic
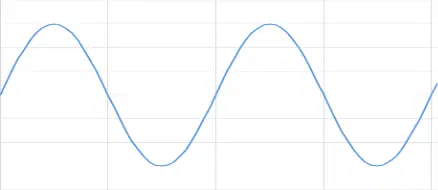
Which graph is likely to represent periodic changes, such as cycles or waves?
Linear
Trigonometric
Exponential
Parabolic
What type of graph typically shows growth that increases at a progressively higher rate?
Linear
Trigonometric
Exponential
Hyperbolic
What is the general equation for a straight-line graph?
y = mx + b
y = mx^2 + b
y = m/x + b
y = mx - b
What does the gradient of a line measure?
The length of the line
The steepness of the line
The midpoint of the line
The area under the line
How is the gradient represented in the equation of a straight-line graph?
As the variable 'b'
As the variable 'x'
As the variable 'm'
As the variable 'y'
What is the general equation for a straight-line graph?
y = mx + b
y = mx^2 + b
y = m/x + b
y = mx - b
What does the y-intercept of a line represent?
The value at which the line crosses the x-axis
The slope of the line
The value at which the line crosses the y-axis
The maximum value of y
What is represented by 'b' in the straight-line equation y = mx + b?
The slope of the line
The x-intercept of the line
The y-intercept of the line
The maximum value of y
What is the general equation for a straight-line graph?
y = mx + b
y = mx^2 + b
y = m/x + b
y = mx - b
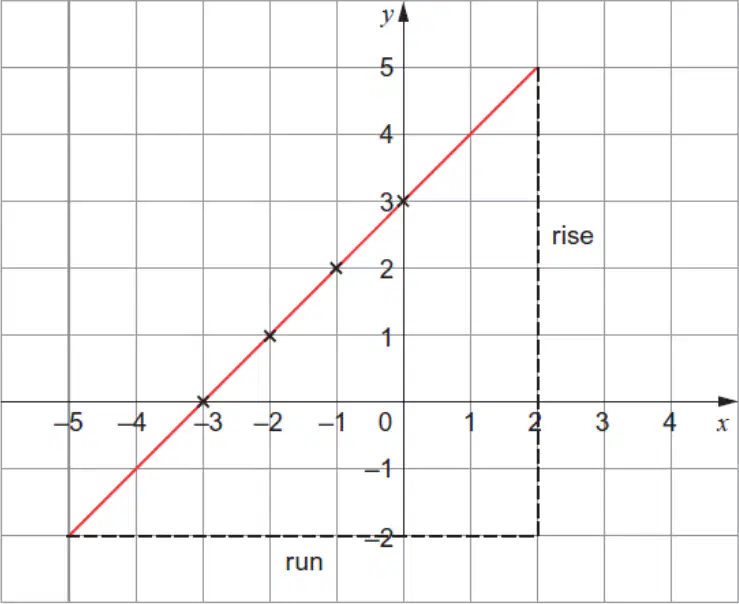
What is the gradient of the line shown in the graph?
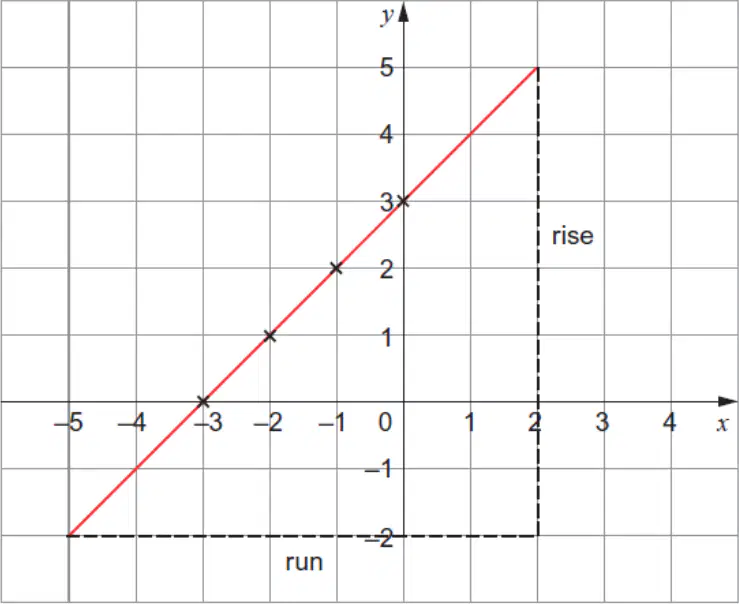
What is the y-intercept of the line shown in the graph?
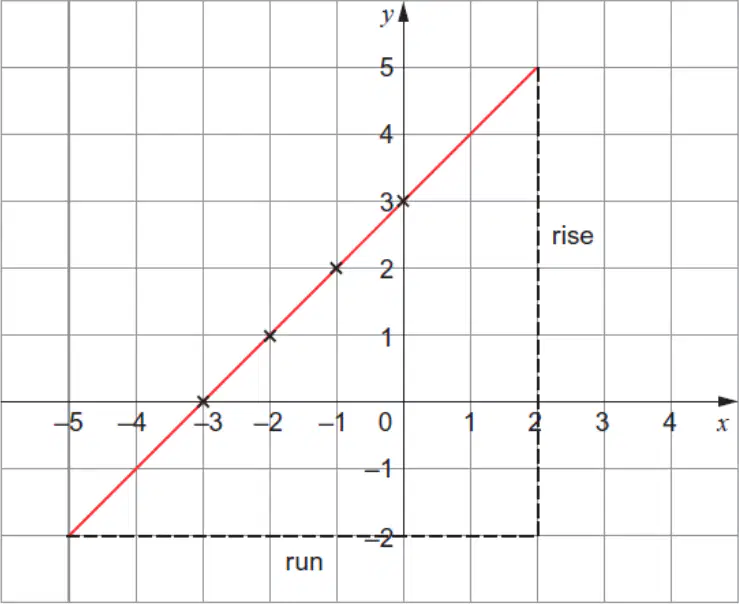
Based on the graph, what is the equation of the line?
What does the graph represent in the context of the learning material?
The temperature change of copper with the amount of zinc it contains.
The resistance of a piece of copper against the amount of aluminum it contains.
The electrical conductivity of aluminum as its weight increases.
The tensile strength of copper-aluminum alloys with varying aluminum content.
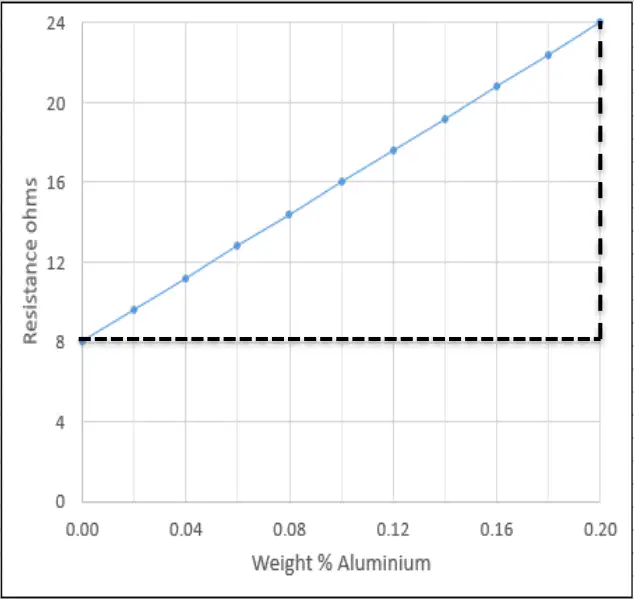
What is the equation of the straight line shown in the graph?
Resistance = 80 x % copper + 8
Resistance = 80 x % aluminum + 8
Resistance = 8 x % aluminum + 80
Resistance = % aluminum x 80 - 8
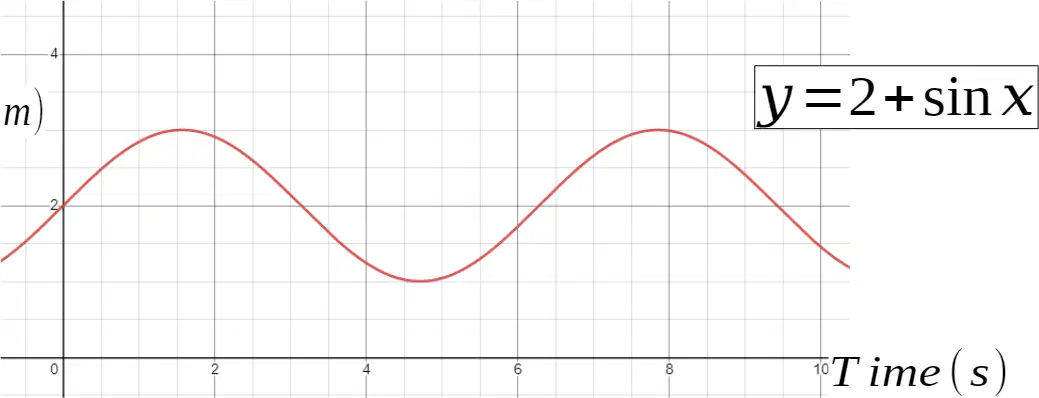
In the 10-second period shown, how many times does the height exceed 2.5 m?
0 times
1 time
2 times
3 times
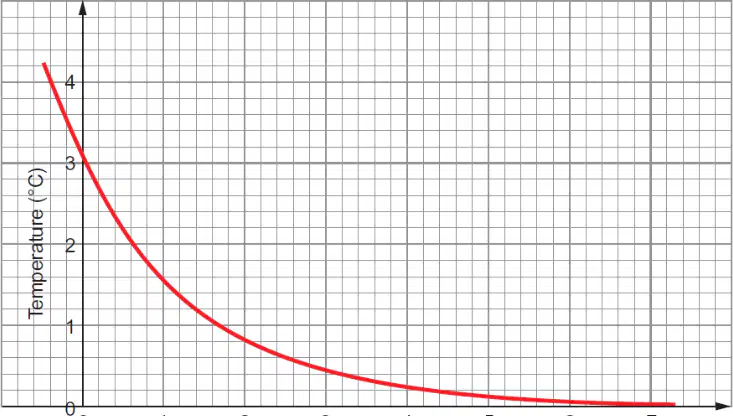
What is the starting temperature of the metal?
0°C
2°C
3°C
4°C
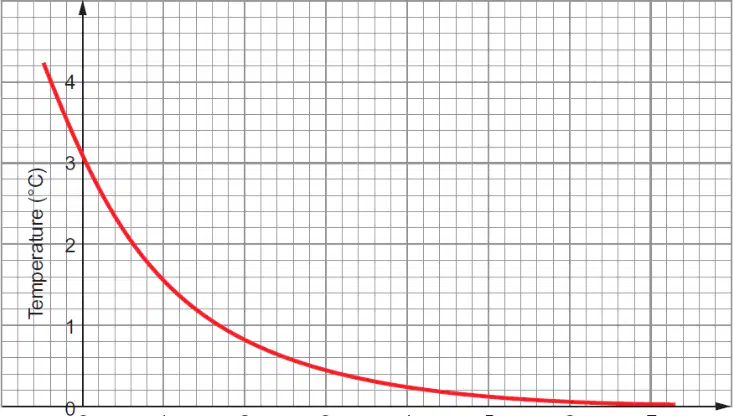
Determine the time taken (to the nearest minute) for the metal to cool to 1°C.
Approximately 2 hours
Approximately 3 hours
Approximately 4 hours
Approximately 5 hours

