
Font size
 Worksheets
FREQUENCY DISTRIBUTION TABLE
Total questions: 119
Worksheet time: 6hrs 49mins

This is the interval between two consecutive upper (or lower) class limits.
class width
class boundaries
midpoints
frequency

These are used as the border between two consecutive bars in a histogram. They are the intermediate value between an upper class limit and the next lower class limit.
class limits
class boundaries
frequencies
class marks

Why is this frequency distribution incorrect?
The fourth class width is different from the others
There is a zero.
Classes should overlapped.

Find the midpoints.
25.5, 35.5, 45.5, 55.5, 65.5, 75.5
20.5, 30.5, 40.5, 50.5, 60.5, 70.5, 80.5
21, 31, 41, 51, 61, 71
30, 40, 50, 60, 70, 80

Find the relative frequencies
37%, 76%, 92%, 95%, 98%, 100%
28%, 30%, 12%, 2%, 2%, 2%
33%, 37%, 20%, 7%, 7%, 7%
37%, 39%, 16%, 3%, 3%, 3%

Find the cumulative frequencies.
28, 56, 84, 100
28, 58, 70, 72, 74, 76
33%, 37%, 20%, 7%, 7%, 7%
28, 30, 12, 2, 2, 2

Look at the frequency distribution. Find the class boundaries.
21, 31, 41, 51, 61, 70, 80
25.5, 35.5, 45.5, 55.5, 65.5, 75.5
20.5, 30.5, 40.5, 50.5, 60.5, 70.5
30, 40, 50, 60, 70, 80

Complete the definition:
class boundaries
lower class limits
upper lass limits
midpoints
Which of the following is the correct formula to find class width?
(max-min)/(# of classes), round up to the next integer
(max-min)/2, round up to the next integer
(max-min)/(# of classes), round normally
(max+min)/2, round normally
(max-min)/(number of data), round up to the next integer

What would be the cumulative frequency for the third class?
5
12
17
18
Data obtained in the original form is known as raw data

This is an ogive.
true
false
What is another name for the ogive?
Histogram
Frequency Polygon
Cumulative frequency graph
Pareto chart

The data shows the number of albums, sold to the nearest million, of the top-selling albums of all time.
How many albums sold more than 25 million copies?
15
5
2
1

How many albums sold less than 20 million copies?
25
20
15
10

What is the total number of albums sold?
10
15
20
25

The table shows the number of hours the band members practiced in a week.
Which number of hours practicing is most common?
1
2
3
4

How many band members practiced more than 4 hours a week?
1
2
3
4

The frequency distribution table represents the amount of sugar in mg/l for a sample of bottled drinks:
What is the class size or width?
4
25
5
29

What is the class interval?
5
6
7
8

What is the lower limit of the 3rd class interval?
13.0
18.0
23.0
28.0

What is the class mark of the 5th class interval?
30
25
20
15

What is the class boundary of the 1st class interval?
2.5 - 7.5
7.5 - `12.5
12.5 - 17.5
17.5 - 22.5
What is another name for the ogive?
Histogram
Frequency Polygon
Cumulative Frequency Graph
Pareto Chart
What are the true class boundaries for the class interval 8 - 9?
8.5 - 9.5
7.5 - 9.5
8.55 - 9.55
8 - 9
In the construction of a frequency distribution, it is a good idea to have overlapping class limits, such as 10-20, 20-30, 30-40.
True
False

Use the given frequency distribution to find the
(a) class width
(b) midpoints of the first class
(c) boundaries of the first class
(a) 3
(b) 51
(c) 50 - 52
(a) 2
(b) 51.5
(c) 50 - 52
(a) 3
(b) 51
(c) 49.5 - 52.5
(a) 2
(b) 51.5
(c) 49.5 - 52.5

Identify the class with the highest relative frequency.
95 - 105
105 - 115
115 - 125
125 - 135
A city in the Pacific Northwest recorded its highest temperature at 91 degrees Fahrenheit and its lowest temperature at 12 degrees Fahrenheit for a particular year. Use this information to find the upper and lower limits of the first class if you wish to construct a frequency distribution with 10 classes
7 - 17
12 - 19
12 - 20
12 - 18

Use the frequency histogram to determine the class width
7
8
9
10

Use the ogive to approximate the cumulative frequency for a height of 72 inches.
36
43
48
51
What would be the cumulative frequency for the third class?
5
12
17
18

Tells you how often something happened.
Range
Frequency
Class Size
Class Interval
In the frequency distribution table, where does the tally of values being put into?
First Column
Second Column
Third Column
None of the Above
It lists items and uses tally marks to record and show the number of times data values occur.
Frequency
Frequency Table
Frequency Distribution Table
Tally
Smallest or highest data that can be included in the class.
Class Interval
Class Width
Class Mark
Class Limit
The midpoint of the classes.
Class Interval
Class Width
Class Mark
Class Limit

What is the number of classes in the given problem?
(a)

Check the highest and the lowest score/value.
1
2
47
49
What is the formula in finding the class interval?
c.i.=nLS − HS
c.i.=nLS−HS
c.i.=kLS−HS
c.i.=kHS−LS

Solve for the class interval
(a)
What is the formula in finding the first class?
LS + c.i. - 1
LS + c.i. + 1
LS - c.i. - 1
LS - c.i. + 1
Give the other term for midpoint.
midpoint
classmark
middle
center

What is the classmark of the second class?
12
12.5
17
17.5
How to find the class boundaries?
LL - 0.5 and UL - 0.5
LL + 0.5 and UL + 0.5
LL - 0.5 and UL + 0.5
LL + 0.5 and UL - 0.5

What is the class boundaries of the third class?
8.5 - 16.5
16.5 - 24.5
24.5 - 32.5
32.5 - 40.5

Let find the class interval with highest frequency ?
19
58
56-65
86-95

Find the cumulative frequency of the sixth class interval ?
16
19
74
82

How many student got score between 36 - 45 ?
12 students
13 students
26 students
39 students

How many student got score between 76-85
82 students
74 students
16 students
8 students

How many students score less than 46
26 students
39 students
58 students
74 students

Find the number of class ?
8
9
10
11

Find the interval of class ?
7
8
9
10

How many students participated in this exam?
85 students
81 students
74 students
60 students

Let find upper boundary of the lowest frequency class interval ?
95.5
90.5
85.5
86-95

Determine the middle point of the fourth class interval ?
60.5
50.5
40.5
46-55

How many students have a score of less than or equal to 75
16 students
19 students
58 students
74 students

How many students got a score of more than 35
62 students
65 students
69 students
71 students

How many students got a score of more than or equal to 76 ?
8
11
13
82
What is another name for the ogive?
Histogram
Frequency Polygon
Cumulative frequency graph
Pareto chart
What are the boundaries for 8 - 9?
8.5 - 9.5
7.5 - 9.5
8.55 - 9.55
8 - 9
In the construction of a frequency distribution, it is a good idea to have overlapping class limits, such as 10-20, 20-30, 30-40.
True
False
The type of graph used to represent data is determined by the type of data collected and by the researcher's purpose.
True
False
Except for rounding errors, relative frequencies should add up to what sum?
0
1
50
100
Use the given frequency distribution to find the
(a) class width
(b) midpoints of the first class
(c) boundaries of the first class
(a) 3
(b) 51
(c) 50 - 52
(a) 2
(b) 51.5
(c) 50 - 52
(a) 3
(b) 51
(c) 49.5 - 52.5
(a) 2
(b) 51.5
(c) 49.5 - 52.5

Use the ogive to approximate the number in the sample.
100
28
80
341
Identify the class with the highest relative frequency.
95 - 105
105 - 115
115 - 125
125 - 135
Identify the class with the least relative frequency.
115 - 125
125 - 135
135 - 145
145 - 155
Approximate the greatest relative frequency.
0.03
0.15
0.25
0.35
Approximate the least relative frequency.
0.03
0.15
0.25
0.35
A city in the Pacific Northwest recorded its highest temperature at 91 degrees Fahrenheit and its lowest temperature at 12 degrees Fahrenheit for a particular year. Use this information to find the upper and lower limits of the first class if you wish to construct a frequency distribution with 10 classes
7 - 17
12 - 19
12 - 20
12 - 18
Use the frequency histogram to determine the number of classes.
5
6
7
8
Use the frequency histogram to determine the class width
7
8
9
10
Use the ogive to approximate the location of the greatest increase in frequency.
58 - 60
60 - 62
62 - 64
64 - 66
Use the ogive to approximate the greatest increase.
5
10
15
20
Use the ogive to approximate the cumulative frequency for a height of 72 inches.
36
43
48
51
Use the ogive to approximate the height for which the cumulative frequency is 25.
62
64
66
68

Use the frequency polygon to identify the class with the greatest frequency.
20.5 - 23.5
29.5 - 32.5
35.5 - 38.5

What is the Mode of this data?
96
97
68
802

How many data items are on the plot?
16
21
22
100

What is the Mode of this data?
74
56888
68
45
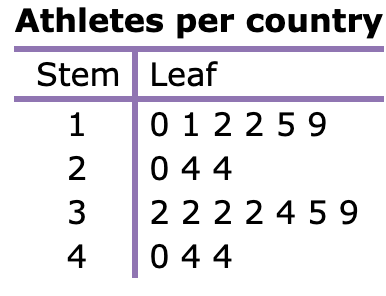
While doing a project for P. E. class, Ling researched the number of athletes competing in an international sporting event.
How many countries have exactly 32 athletes?
4
3
6
1

The employee at the department store counted the number of ties on each tie rack.
How many racks have between 30 and 40 ties?
4
2
7
5

A Technical Assistance Manager monitored his customers' wait times.
What is the shortest wait time?
30 minutes
48 minutes
31 minutes
71 minutes

A machine dispensed red gumdrops into bags of various sizes.
How many bags had at least 15 red gumdrops?
33
23
25
27

A veterinarian weighed all the dogs that visited his office last month.
How many dogs weighed exactly 22 pounds?
2
0
1
3


What is the median of this data?
53
55.5
54
57
What is the mean football score?
35 points
17 points
270 points
18 points

The table shows the scores of 40 students in their Math Quiz. What is the frequency of the scores from 21-25?
9
8
15
6

The following are the scores obtained by a group of 30 Grade 7 students in Science Quiz. What is the frequency of the scores from 6-10?
7
4
13
3


How many boys have shoes that are 18 centimeters long?
6
10
2
5


What is a histogram?
A graphical representation of data using bars of different heights
The average of a set of numbers
The middle value in a set of numbers
The most frequently occurring value in a set of numbers
Which measure of central tendency represents the most frequently occurring value in a set of numbers?
Mean
Median
Mode
Range
What is the range of a set of numbers?
The average of a set of numbers
The middle value in a set of numbers
The difference between the largest and smallest values in a set of numbers
The most frequently occurring value in a set of numbers
Which measure of central tendency represents the middle value in a set of numbers?
Mean
Median
Mode
Range
What is the mean of a set of numbers?
The average of a set of numbers
The middle value in a set of numbers
The most frequently occurring value in a set of numbers
The difference between the largest and smallest values in a set of numbers
What is the mode of a set of numbers?
The average of a set of numbers
The middle value in a set of numbers
The most frequently occurring value in a set of numbers
The difference between the largest and smallest values in a set of numbers
What is the median of a set of numbers?
The average of a set of numbers
The middle value in a set of numbers
The most frequently occurring value in a set of numbers
The difference between the largest and smallest values in a set of numbers
What is data analysis?
The process of organizing, interpreting, and summarizing data
The process of collecting data
The process of presenting data
The process of analyzing graphs
Which measure of central tendency represents the average of a set of numbers?
Mean
Median
Mode
Range
What is the purpose of frequency distribution in data analysis?
To organize data into categories and display the number of observations in each category
To calculate the mean of a set of numbers
To find the middle value in a set of numbers
To determine the most frequently occurring value in a set of numbers

Find the class limits and frequency.


Find the range.
(a)
Decide on the number of class using Sturges' Rule.
k ≈ 5
k ≈ 6
k ≈ 7
k ≈ 8
Find the class width.
c = 5
c = 6
c = 7
c = 8
Find the class limits and frequency.

