
 Worksheets
FINALS | Biostatistics Practice Quiz
Total questions: 46
Worksheet time: 1hrs 21mins
It is defined as the relationship or association between two quantitative variables without being able to infer causal relationships
Relational statistics
None of the choices
Correlation
Relationship coefficient
It is a statistical technique used to determine the degree to which two variables are related
Correlation
Pearson r method
Relational statistics
Chi square
It is a rectangular coordinate where two quantitative variables are compared to determine if there is a relationship with each other.
Line diagram
Scatter diagram
It is a rectangular coordinate where two quantitative variables are compared to determine if there is a relationship with each other.
Line diagram
Scatter diagram
It is a rectangular coordinate where two quantitative variables are compared to determine if there is a relationship with each other.
Line diagram
Scatter diagram
Which of the following is NOT a given relationship when two variables are compared?
Positive
Negative
No relationship
Moderately invalid

What kind of relationship does this scatter diagram indicate?
Negative
Positive
No relationship
It cannot be determined since there are no definite variables.

What kind of relationship does this scatter diagram indicate?
It cannot be determined since there are no tables.
No relationship
Positive
Negative

What kind of relationship does this scatter diagram indicate?
No relationship
Positive
Negative
Negatively askewed
It is defined as the numerical description or measure of the linear relationship between two variables.
It is called Pearson's correlation or product-moment correlation coefficient.
It measures the nature and strength between two variables of the quantitative type
FILL IN THE BLANKS RESPECTIVELY:
The ____ of "r" represents the nature of association, while the ___ of "r" represents the strength of association.
sign, correlation coefficient
value, correlation coefficient
value, sign
sign, value
Mr. Jack runs an ice cream business. He observed that when the temperature goes up, ice cream sales also go increase. Predict the relationship.
Direct correlation between temperature and ice cream sales.
Invalid correlation between temperature and ice cream sales.
Ms. Flora runs a local garden in Silang, Cavite. She observed that the more it rains, the less she can water the garden. Predict the relationship.
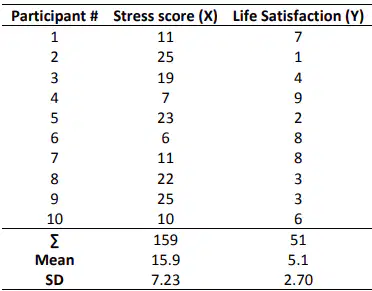
A researcher has gathered the following data to see if there is a relationship between stress and life satisfaction.
Find the correlation coefficient and predict its relationship.
r=(n Σ x2−(Σ x)2)−(n Σ y2−(Σ y)2)n Σ xy−Σ x Σ y
r = 0.89, direct relationship
r = -0.96, inverse relationship
r = -0.69, inverse relationship
r = 0.72, direct relationship
It is the nonparametric version of the Pearson product-moment correlation.
Spearman's rank-order correlation coefficient
It measures the strength and direction of association between two ranked variables.
Spearman's rank-order correlation coefficient
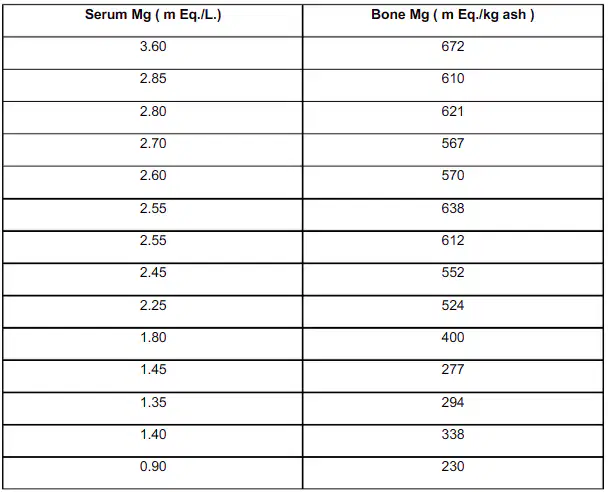
Use the Spearman Rank-Order Correlation to determine whether if there is a relationship between these two variables and find the correlation coefficient. (Click the image to view)
The critical value is 0.538.
p=1−n (n2−1)6 Σ d2
p = 0.8868, there is a relationship between the two variables.
p = 0.8624, there is a relationship between the two variables
p = 0.4432, there is NO relationship between the two variables
p = 0.5219, there is NO relationship between the two variables
TRUE OR FALSE
Kendall’s Tau is a non-parametric measure of relationships between columns of non-ranked data.
TRUE
FALSE
It is a non-parametric analogue to the Pearson Product Moment Correlation
It is defined as the number of observed ranks below a particular rank which are larger than a particular rank.
Non-Kendall pairs
Discordant pairs
Concordant pairs
It is defined as the number of observed ranks below a particular rank which are smaller in value than that particular rank
Discordant pairs
Concordant pairs
Chi-square pairs
None of the above.
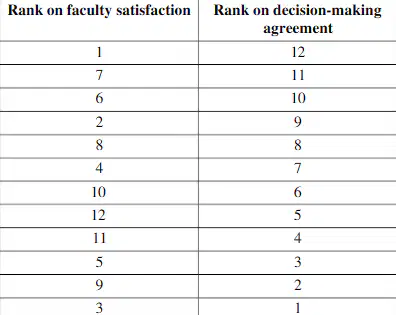
A researcher has gathered the following data to determine whether or not there is a relationship between the two variables. Find also the test statistic. Kendall′s Tau=C+DC−D
x = 0.7617, high direct relationship
x = -0.2424, negligible inverse relationship
x = -0.4922, low inverse relationship
Cannot be determined.
It is used for contingency tables when at least one variable is a nominal variable.
Phi coefficient
It is defined as categorical variables with two categories.
Dichotomous variables
It is a measure of association between two binary variables.
Phi Coefficient
It is also called the Yule phi or Mean Square Contingency Coefficient and is used for contingency tables
Phi Coefficient
It is defined as a special type of frequency distribution table which are used in statistics to summarize the relationship between several categorical variables.
It is a statistical test that compares the averages or means and standard deviations of two related groups to determine if there is a significant difference between the two groups.
Also known as a dependent t-test
Nonparametric t-test
Which of the following is NOT an assumption of a paired t-test?
The dependent variable is normally distributed.
The dependent variable is measured on an incremental level, such as ratios or intervals.
The observations are sampled dependently.
The independent variables must consist of two related groups or matched pairs.
A study where it observes the sleep quality of Biochemistry students before and after a certain sleeping therapy program is an example of what kind of t-test?
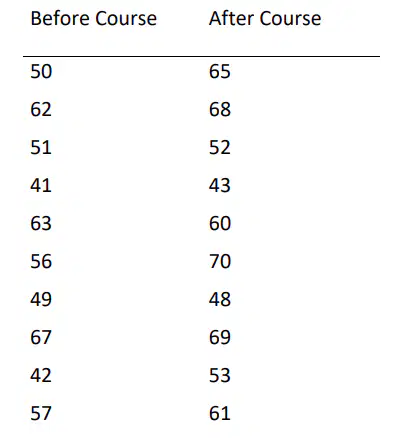
A gym instructor wants to find out if his training program is statistically significant. In the table are the measured scores of the students before and after the program. Find also the test statistic.
The critical value is 2.262.
t=n(n−1)n Σ D2−(Σ D)2mean of D ×n
t = -0.234, not statistically significant
t = -3.11, statistically significant
t = -2.58, statistically significant
t = 1.24, not statistically significant
It is a statistical procedure that compares the averages/means of two independent or unrelated groups to determine if there is a significant difference between the two.
Unpaired t-test
Paired t-test
Which of the following is NOT an assumption of an unpaired t-test?
The dependent variable is normally distributed
The variance of data is the different between groups, meaning that they have the different standard deviation
The observations are sampled independently
The independent variables must consist of two independent groups
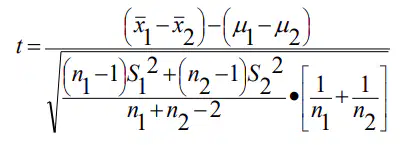
What does this formula solve?
test statistic for independent t-test
test statistic for dependent t-test
Wilcoxon Rank-Sum test
test statistic for correlation coefficient
It is used for comparing means between more than 2 groups.
Nonparmetric ANOVA
ANOVA
In ANOVA, which is the independent variable?
Ordinal variable
Categorical variable
Nonparametric variable
In ANOVA, which is the dependent variable?
Categorical variable
Continuous or quantitative variable
Nonparametric variable
Which of the following is NOT an assumption of ANOVA?
Observations were randomly and independently chosen from the populations.
Population variances differs for all groups.
Population distributions are normal for each group.
Its distribution arises in tests of hypotheses concerning the independence of two random variables and concerning whether a discrete random variable follows a specified distribution.
It is a nonparametric test where it is used to identify difference between two independent samples of rank-ordered data
The Wilcoxon Signed-Rank test is named after who?
It is designed to test a hypothesis about the location (median) of a population distribution. It often involves the use of matched pairs, for example, before and after data, in which case it test for a median difference of zero
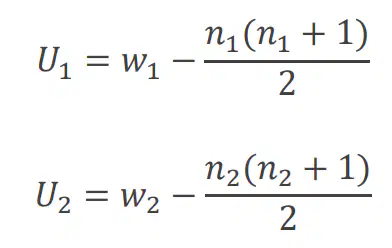
To which test do these formulas belong?
Wilcoxon rank-sum test
Mann-Whitney U
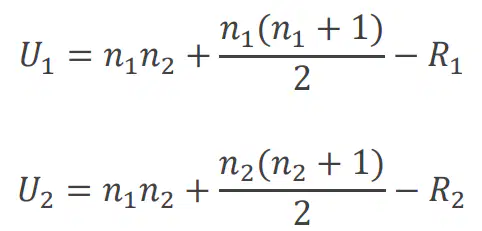
To which test do these formulas belong?
Wilcoxon rank-sum test
Mann-Whitney U

