
 Worksheets
math 4th quarter
Total questions: 79
Worksheet time: 1hrs 19mins
is a branch of Applied Mathematics specializing in procedures for
collecting, organizing, presenting, analyzing, and interpreting data from
observations.
(a)
is one that can be answered by collecting data that vary.
(a)
what are the two types of data?
(a)
those in numerical form which are either continuous or discrete
(a)
2 forms of numerical data set
(a)
are those that can be counted in a finitely (means in a way that has a limit or end.)
(a)
are measurements
that can take any value from an is infinite range
(a)
take non-
numerical values, such as colors, information or questions that are answerable by
YES or NO, labels, etc (example: large, medium, and small)
(a)
The 4 steps below can be followed to solve real life problems using statistics
(a)
There are different statistical instruments that can be formulated and used to
gather data depending on the needs. what are some of the statistical
instruments.
(a)
it focuses in determining the changes in the attitude, characteristics
and behavior of people or other subjects. This technique includes watching and
recording actions and behaviours
(a)
it is being performed through personally asking questions to people
who have the authority or expertise to say something about the data needed.
The person gathering the data is called the interviewer, while the person supplying
the data is the interviewee.
(a)
it is used to know the thinking, feeling or
opinion, about a certain phenomenon, idea and etc. it is conducted with a small
group of people with common knowledge and common field (usually 6 to 8 people).
(a)
on this method data is gathered through a set of questions that is mailed or handed to respondents who are expected to read them
(a)
to determine the cause and effect relationship of a certain phenomenon
(a)
what are the Types of Questions
(a)
These are questions which can be answered with “Yes” or “No,” or they have a
limited set of possible answers
(a)
These are questions that allow someone to give a free-form answer. Example,
“How did you answer the modules?”
(a)
These are questions that provide a certain number of specific response options
as possible answers. An example of multiple-choice question would be:
“How do you spend your free time?”.
a. reading c. surfing the internet
b. listening to radio d. watching TV e. others (please specify: (a) )
in a national level, surveys are usually covered by the government and
other form of surveying organization such as National Statistics Office
(a)
Methods Used in the Collecting Data
(a)
this method of collecting data is an oral or verbal
communication where the interviewer asks questions in any mode to an interviewee. The person gathering the data
is called the interviewer, while the person supplying the data is the
interviewee.
(a)
The person gathering the data
(a)
the person supplying the data
(a)
on this method data is gathered through a set of
question that is mailed or handed to respondents who are expected to read
and understand them. And the respondents then, write down their
responses in the space provided the accomplished questionnaire is then
returned for appropriate processing.
(a)
the data on this method are gathered either
individually or collectively by means of observation. The person who gathers
the data is called an investigator while the person being observed is called
the subjec
(a)
The person who gathers
the data for observation method
(a)
person being observed in an observation method
(a)
this method is used when the objective is to
determine the cause and effect relationship of a certain phenomenon under
controlled condition
(a)
the next step after gathering data
(a)
the number of occurrences of a data
(a)
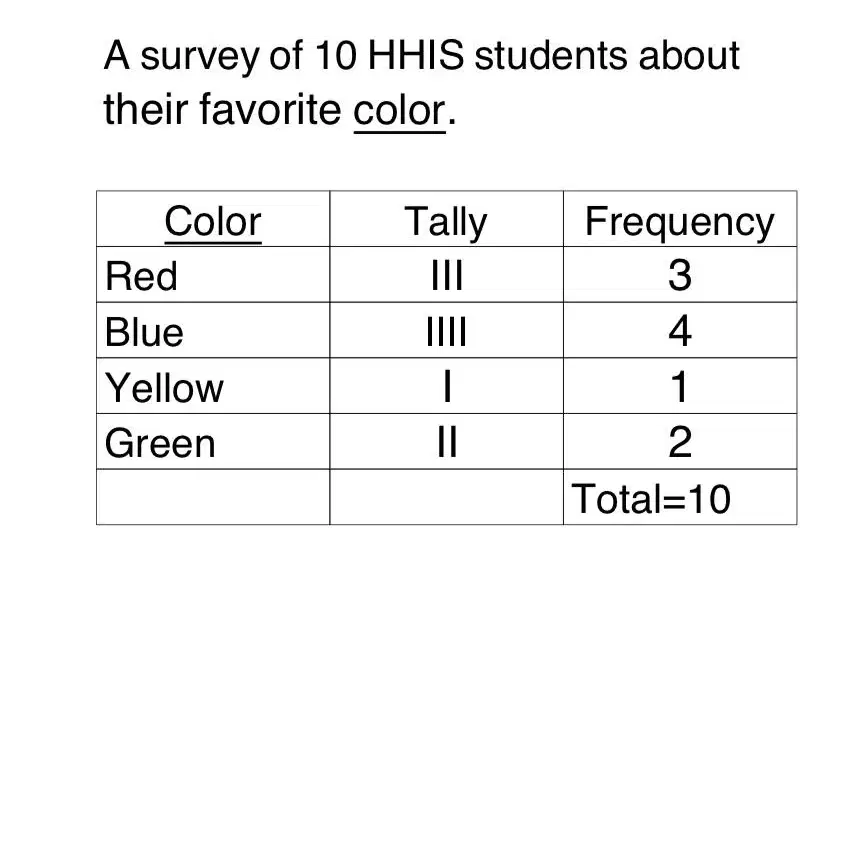
is a table that lists items and shows the number of
times the items occur.
(a)
When data are presented as graph, they are easily interpreted, and compared. As a
consequence, data become more interesting to the readers
(a)
can be presented graphically to give a
better picture of the distribution. Some forms of graphs pie chart, bar graph and line graph.
(a)

is a visual representation of data. It is used to show
how all the parts of something are related to the whole. It is represented by a circle
divided into slices or sectors of various sizes that show each part’s relationship to
the whole and to other parts of the circle.
(a)

uses rectangles (or bars) of uniform width to represent data,
particularly the nominal or categorical type of data. The height of the rectangle
denotes the frequency of the variable
(a)
two types of bar graph
(a)
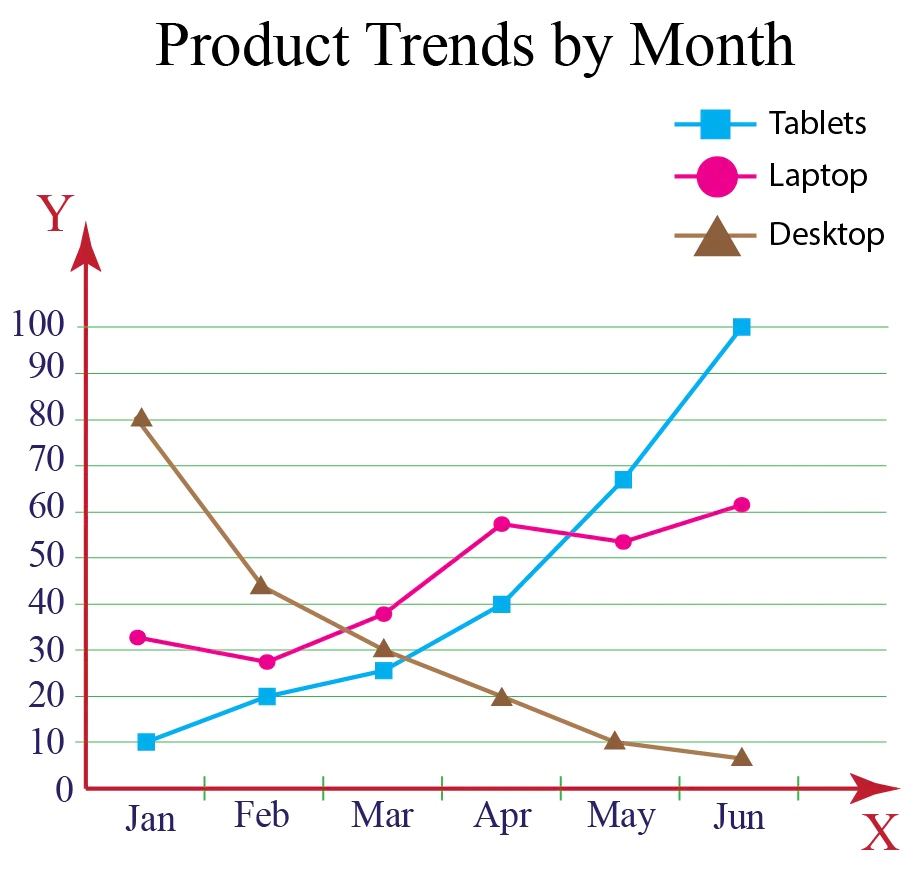
is used to represent changes in data over a period of time. Data like
changes in temperature, income, population, and the like can be represented by a
line graph.
(a)
2 forms of graphs for grouped frequency distribution
(a)
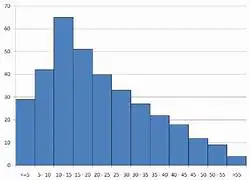
shows the frequency of data that occur within a
certain interval, the bars are always vertical, the width of each bar
is based upon the size of the interval it represents, and there are no gaps between
adjacent bars it has no gaps because their bases cover a continuous
range of possible values.
(a)
(also called the cumulative frequency graph or cumulative frequency curve)
is a graph plotted from a cumulative frequency table. The following examples show
how to draw a cumulative frequency curve for grouped data
(a)
which of the following is an example of statistical questions?
(a)
which if the following statements/question is an example of open ended question?
(a)
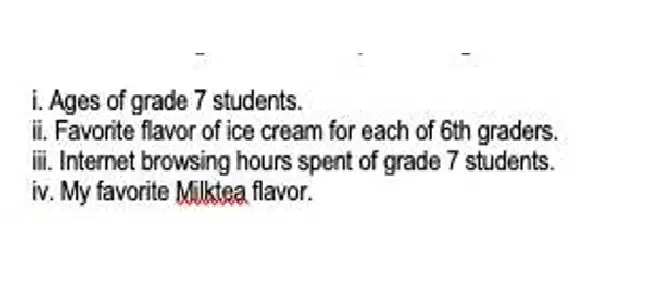
which of the following is NOT an example of categorical data set ?
(a)
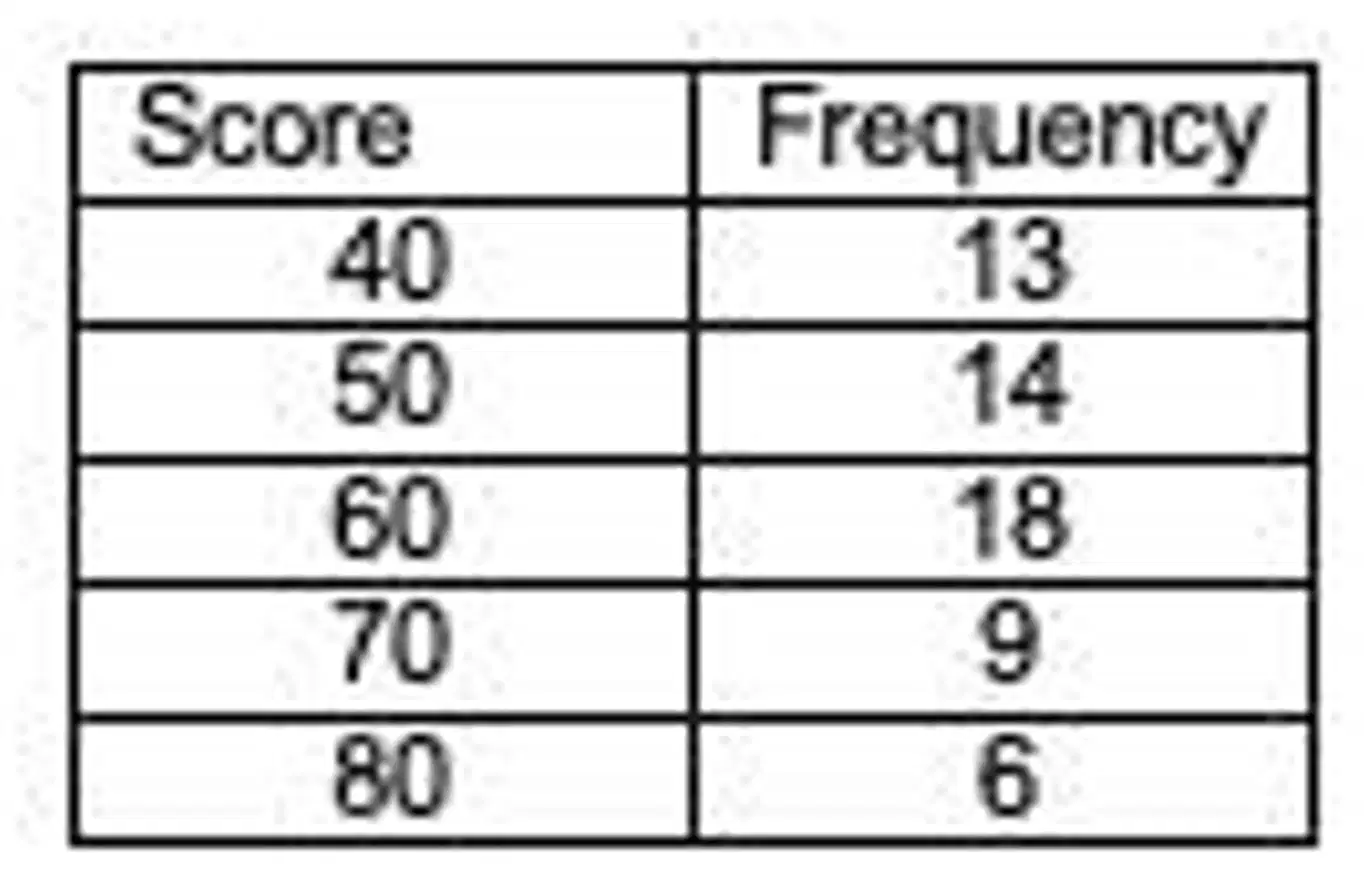
which score has the highest frequency
(a)
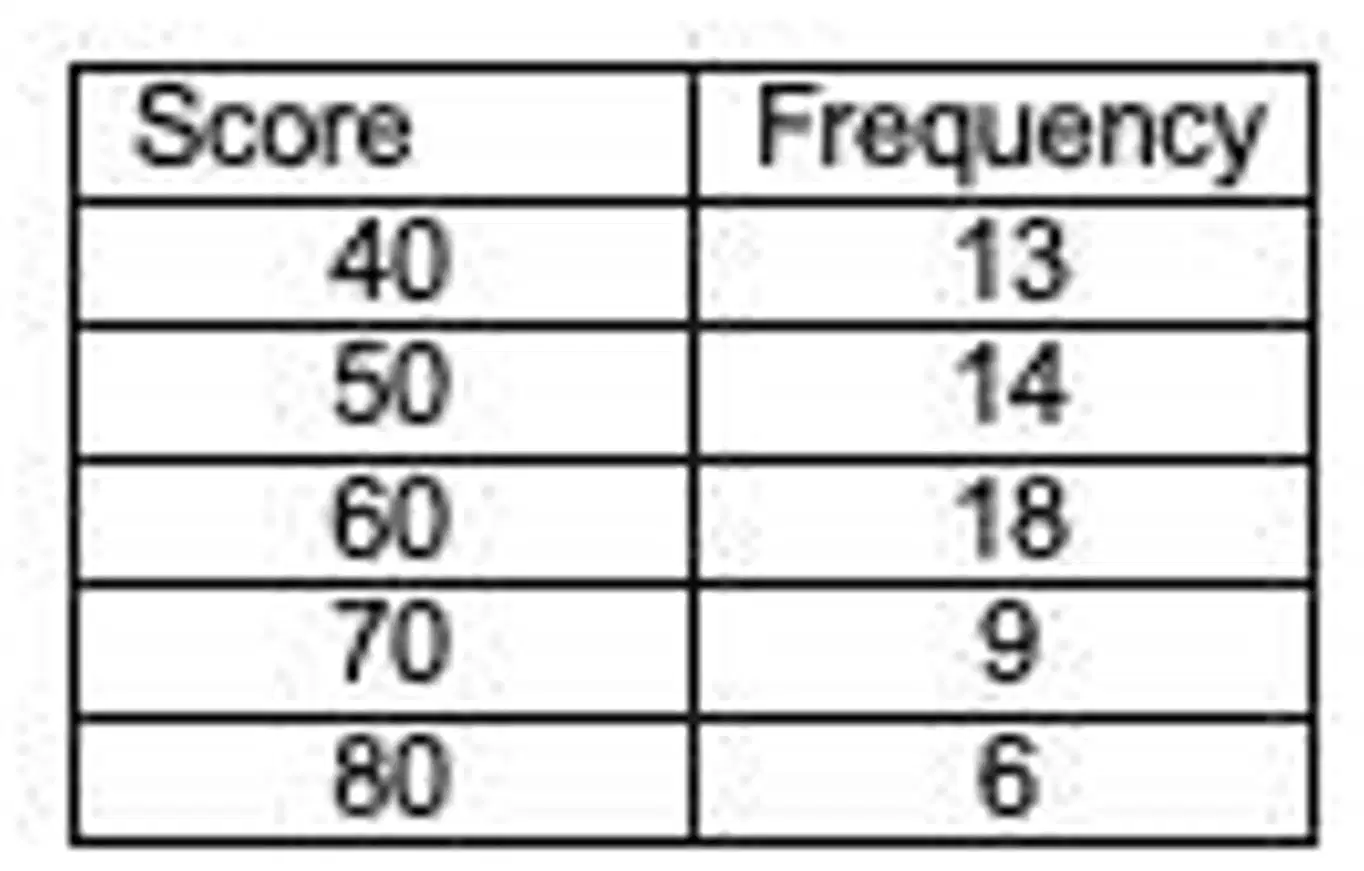
what is the total number of frequency ?
(a)

which of the following shows the graph of histogram?
(a)
Last Thursday, Clint spent 12 hours of the day sleeping and playing 2 hours eating and dressing,6 hours at school and 4 hours surfing the internet. what graph is appropriate to show the percentage of time spent in his activities in a day?
(a)
What appropriate graph can be used to show the population of Region XII in the Philippines from 1989 to 2023
(a)

On what day Mr Frilles worked the most?
(a)

on what day did he work for 5 hours?
(a)
Selena's grade for third quarter on his eight subjects are as follows 90 ,88,85,89,86,92,90,87 ,what is the mean of his grades for 3rd quarter?
(a)
which measure of central tendency is generally used in determining the size of the most in demand shoes?
(a)
Which of the following could be the possible value of X so that the median of the set scores 20,30, 10 50, x 40 ,20 is 29?
(a)
Given the scores 7,4,4,8,5,4,7,9 x what must be the value of X so that the set is bimodal?
(a)
Which of the following score must be inserted in this set 15,25,18,20 so that the median will not be change?
(a)
Sarah recorded the length of time in seconds of the first commercial that aired during a television program, the times she recorded are shown in the table. What is the mean of the lengths of time that Sarah Recorded?
(a)
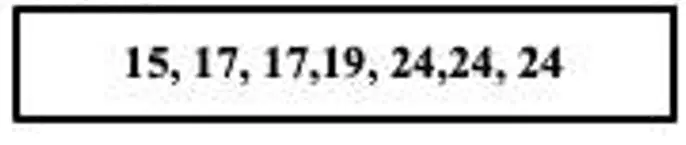
Odette recorded the number of emails she received each day in 7- days. The result are listed below. What is the mode of the numbers of emails Odette receive for 7 days
(a)
The Scores 10 students are 55 ,75,98,,85,75,80,69,88,90, and 95 Find the median
(a)
Lylia's grades in mathematics were 78,80,80 for 3 quarters what must be her grade in the 4th quarter so that her final average in Math is 82.
(a)
Given the interval 24-28,what is the classmark? middle of 24 to 28
(a)
what is the class is the class size of the interval 12-17?
(a)
If the range of set of scores is 48 and the highest score is 68.what is the lowest score?
(a)
Six students from Grade 7 of Ilaya Barangka Integrated school have weights of 87 lbs,82 lbs,11- lbs.98 lbs,79 lbs., and 94 lbs., what is the rang of their weights?110-79=?
(a)
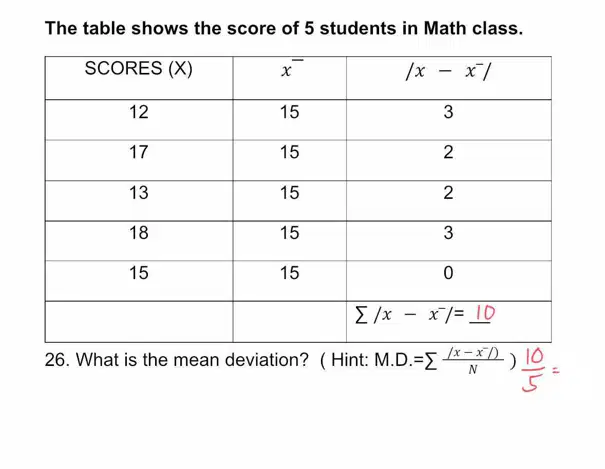
the table shows the score of 5 students what is the mean deviation?
(a)
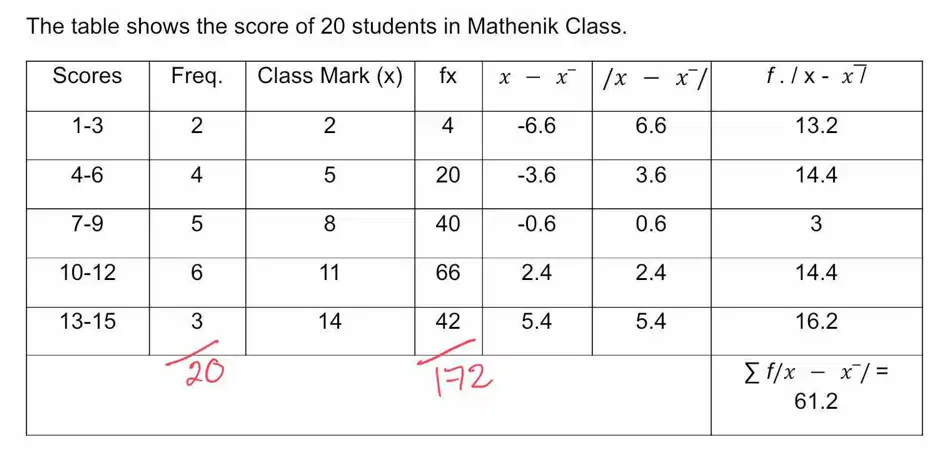
what is the mean grouped data?172÷20
(a)
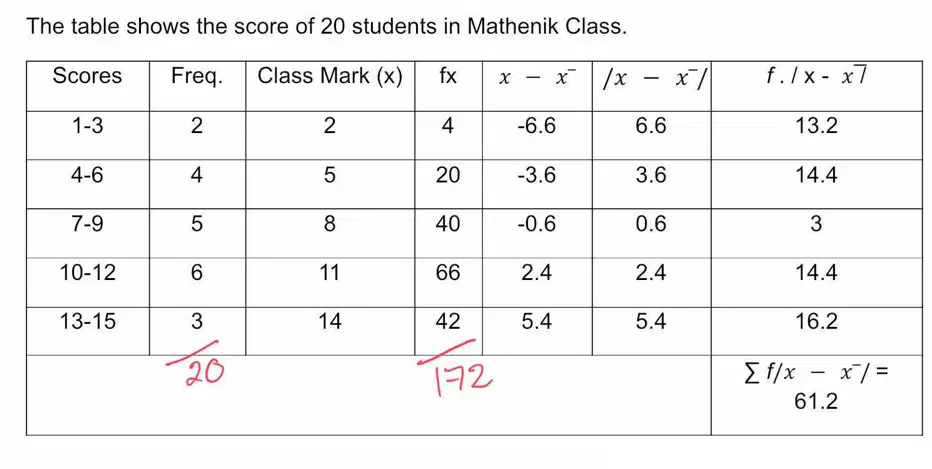
what is the mean deviation?
(a)
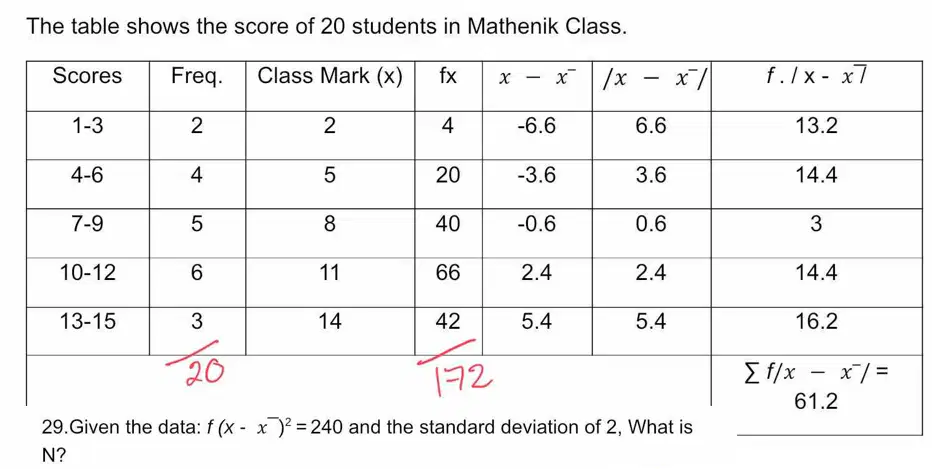
(a)
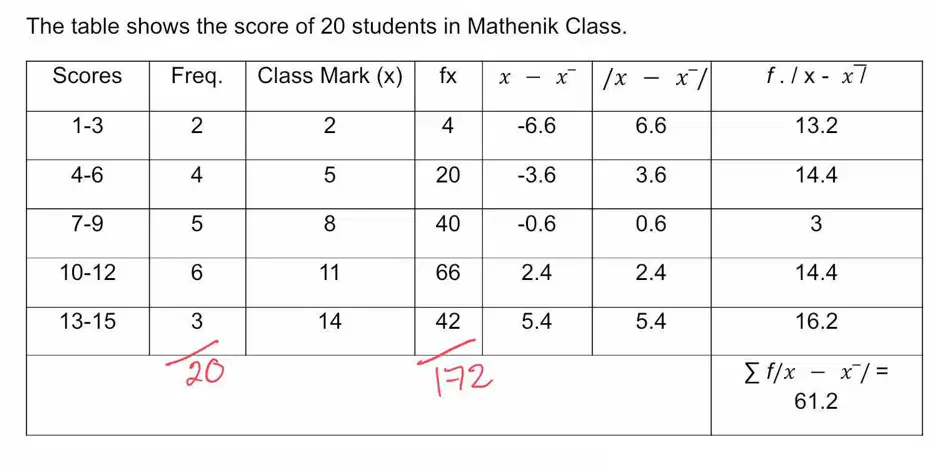
what is the variance data if the sandard deviation is 5?
(a)
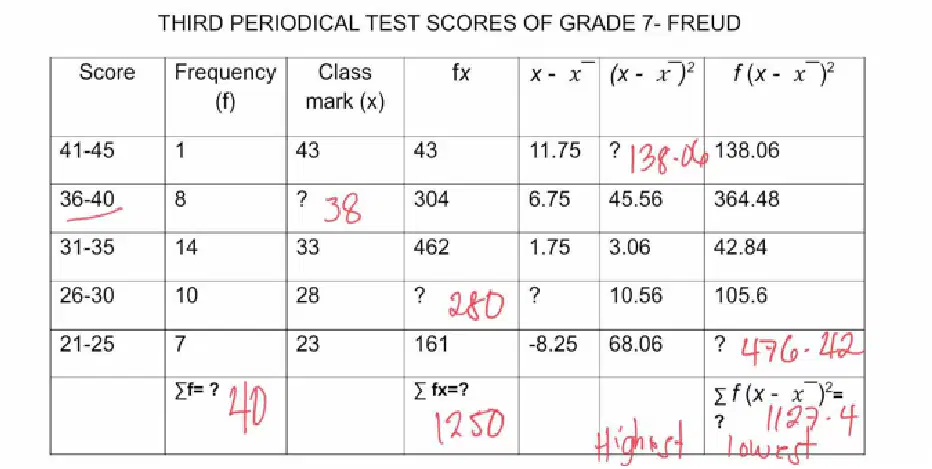
What is the range of the scores of the students?solution 45-21=
(a)
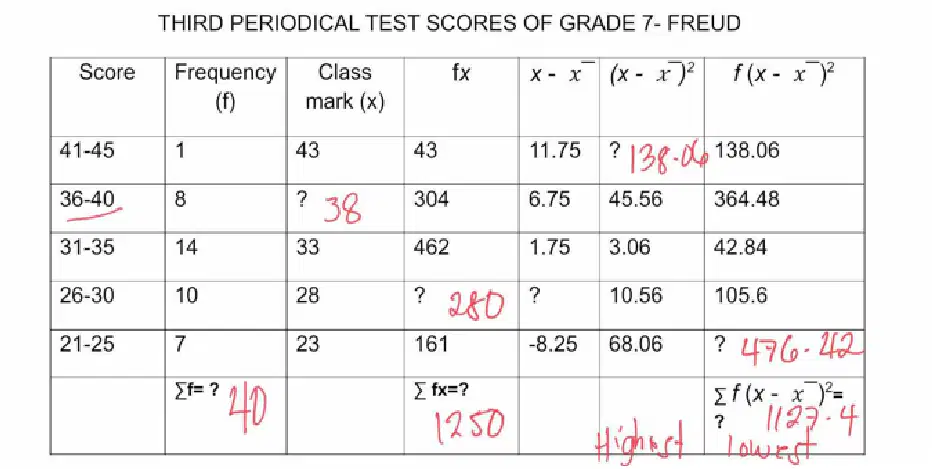
what is the total frequency?
(a)
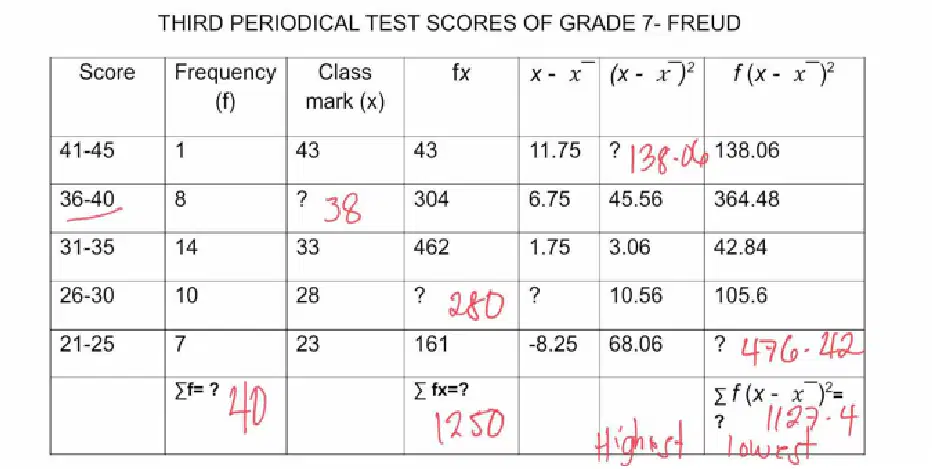
what is the classmark (x) of the class interval 36-40? middle of 36 and 40
(a)
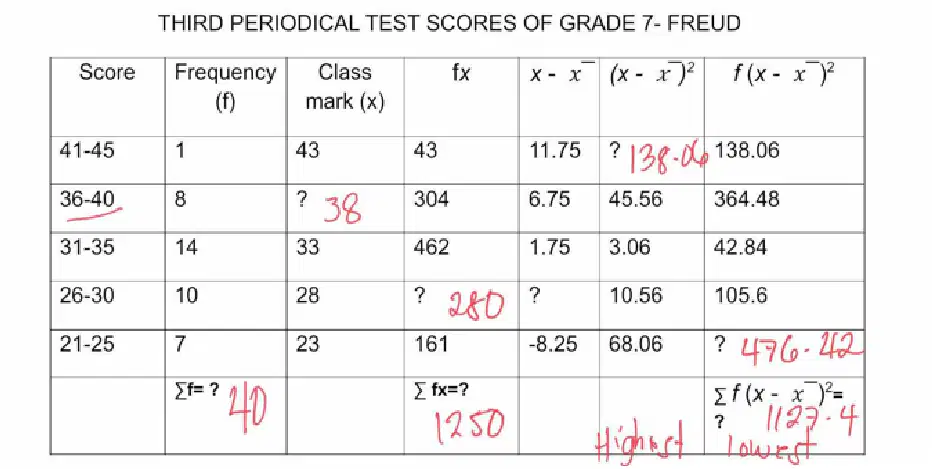
what is the value of fx of the class inteval 26-30? solution 10x 28=
(a)
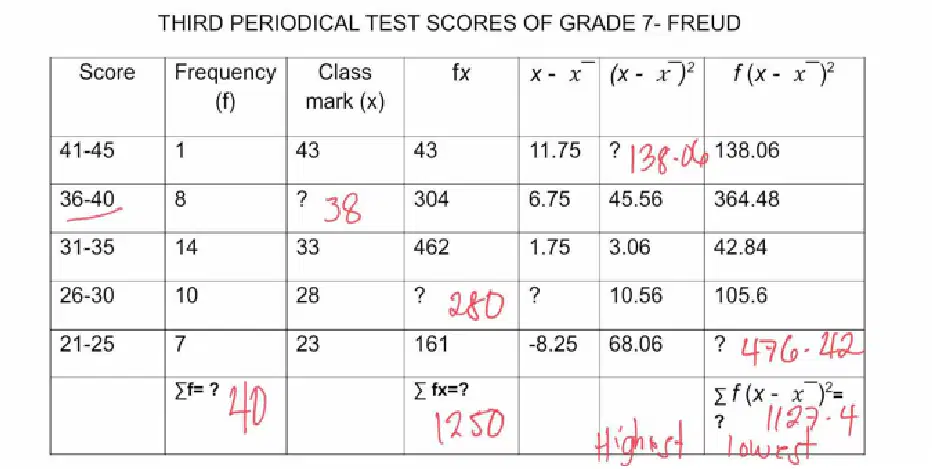
what is the value of ∑ fx?
(a)
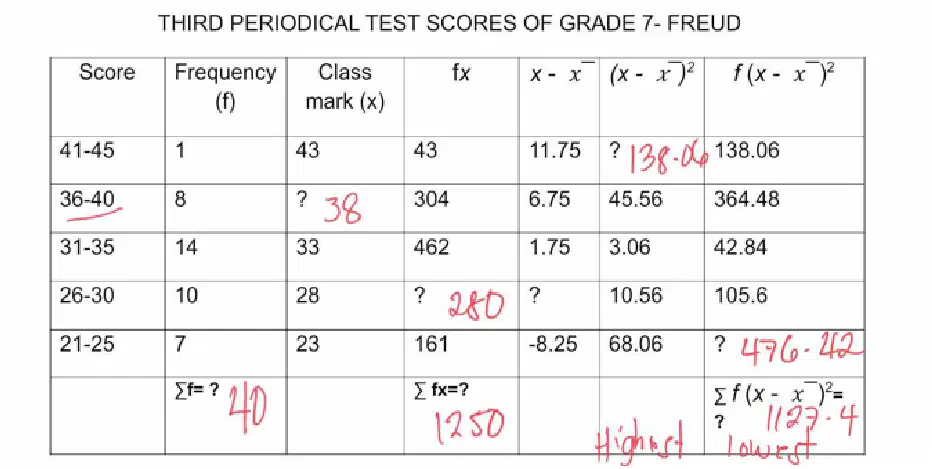
what is the result of ∑ƒ⁽χ-x̄⁾₂
(a)
(a)
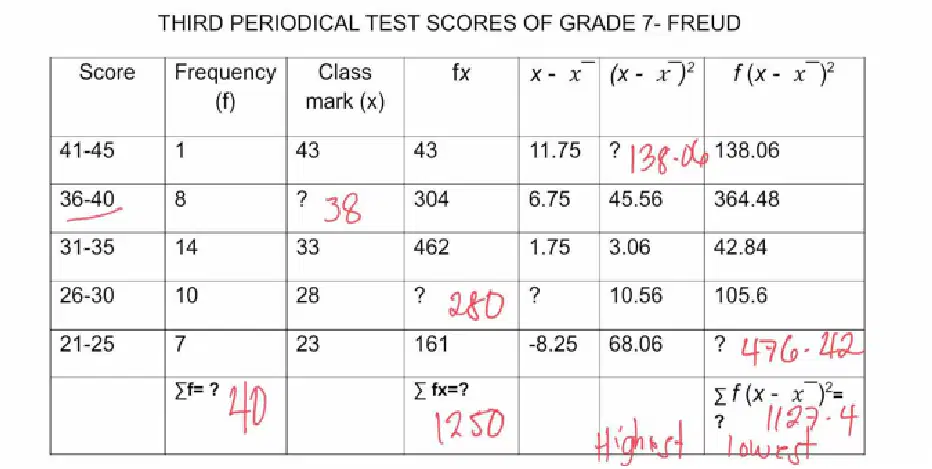
what is the standard deviation √1124.4
-----
40
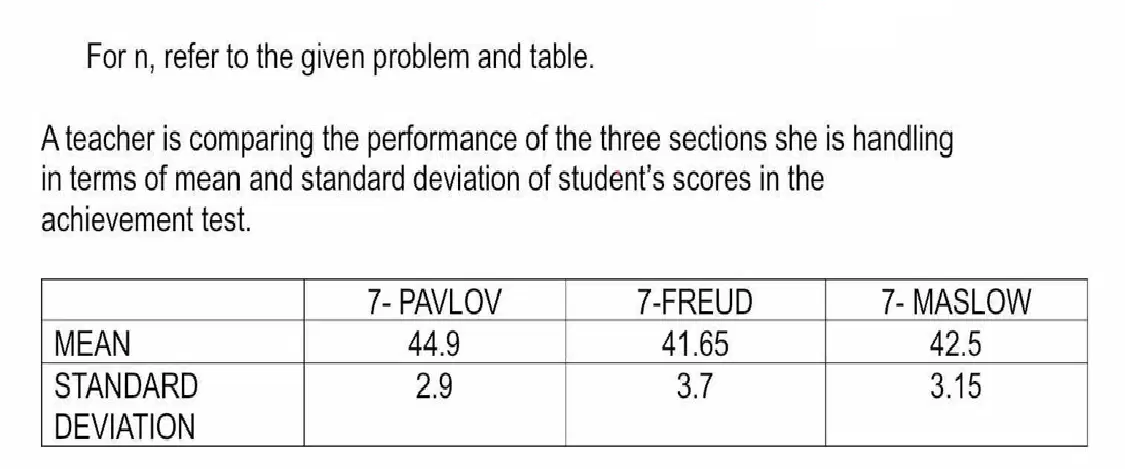
which section likely performed best during test?
(a)
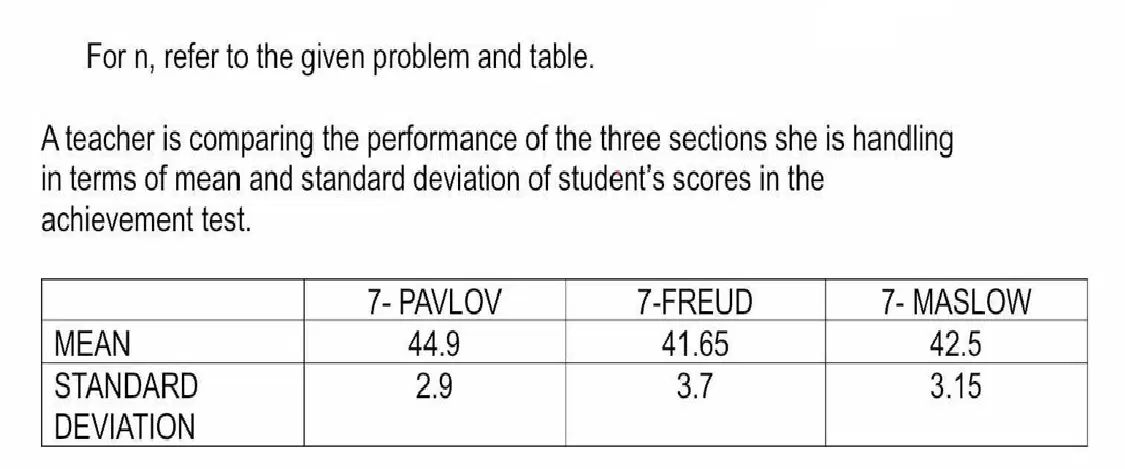
from which section are the scores more different from each other?
(a)
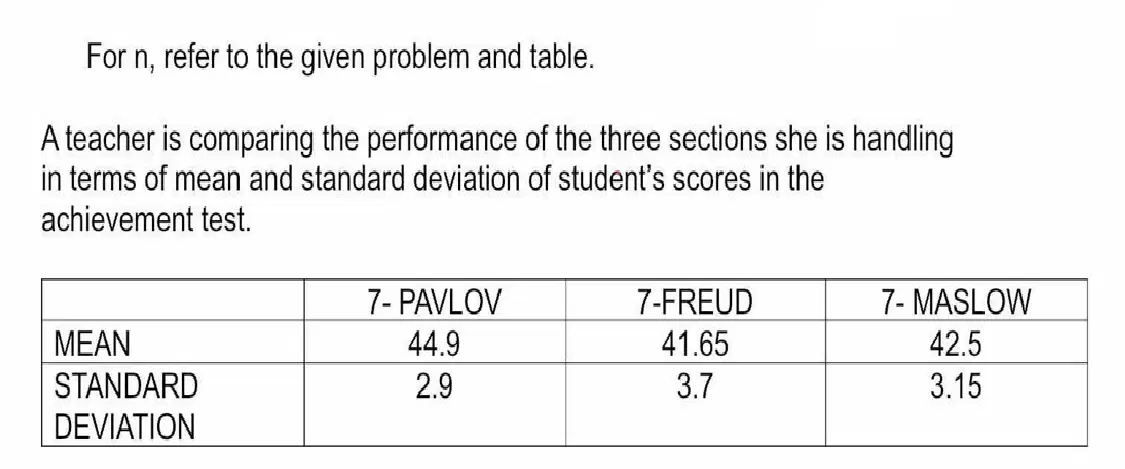
which section is easier likely to handle?
(a)

