
 Worksheets
5-7 Scatter Plots and Lines of Fit A
Total questions: 11
Worksheet time: 29mins
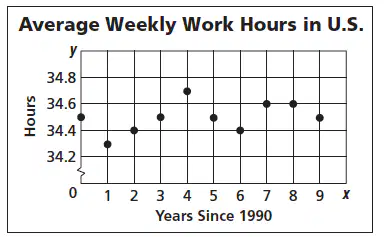
Determine whether each graph shows a positive correlation, a negative correlation, or no correlation.
positive correlation
negative correlation
no correlation

Determine whether each graph shows a positive correlation, a negative correlation, or no correlation.
positive correlation
no correlation.
negative correlation
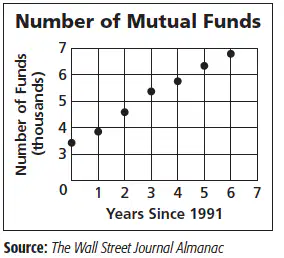
If there is a correlation, describe it.
as time
increases, the number of funds decreases
the number of years increases, the number of funds increases
as time
decreases, the number of funds increase

Write the slope-intercept form of an equation for the line of fit.
The line of fit shown passes through
(1993, 16) and (1999, 5.7).
y = -1.7x + 3404

Use (1997, 13) and (2005, 22) to find the slope.
8/9
9/8
9
8
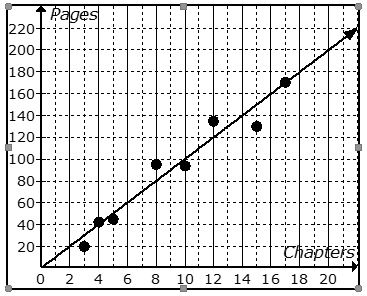


Match the following vocabulary words with their definitions.
a cluster of data that shows a relationship between two numerical variables
Scatter Plot
When x increases, y increases
Positive Correlation
No trend.
Scattered data does not show a relationship.
No Correlation
When x increases, y decreases.
Negative Correlation
The line that best represents data on a scatter plot.
Line of Best Fit

Suppose the equation of the line of best fit for the scatterplot is y=-25x+170
Use the information to predict the remaining distance, when the bicyclist has traveled 3 hours.
95 km
98 km
2 hours
Not enough information.

