
 Worksheets
Grade 9 math review 2
Total questions: 173
Worksheet time: 5hrs 28mins
2n4 /6n4
1/3n
3
3n
1/3


Simplify:
4(x+5)/3(x+5)
4/3
3/4
x+5

Simplify:
x(x-5)/(x+5)(x-5)
x/(x-5)
x/(x+5)
(x+5)/x

Simplify:
(x-3)/2
2/(x-3)
(x+3)/2
2/(x+3)

Simplify:
1/x2
x
1/x
x2

Simplify:
(y-4)/(y-3)
(y+4)/(y+3)
(y+3)/(y+4)
(y-3)/(y-4)

Simplify:
4(x-3)/(x-7)
4(x+3)/(x+7)
4(x+3)(x-7)
4(x-3)/(x+7)

Simplify the algebraic fraction.
-3/b
-b/3
3b
-3b

Simplify the algebraic fraction.
2pq
2/pq
pq/2
p/2q
Simplify: 9m²∕27m³
1⁄3m
3⁄7m²
1∕3m²
3∕m²

6/5x
6/5
(x+3)/(x+2)
(x+3)/(x-4)
Simplify the algebraic fraction.
2pq
2/pq
pq/2
p/2q
The factorisation of 4x + 16 is _______
4(x + 4)
4(x - 4)
x + 4
4x + 4
Simplify the algebraic fraction.
2pq
2/pq
pq/2
p/2q
Simplify the algebraic fraction.
-3/b
-b/3
3b
-3b
Simplify x2x(x−5)
xx−5
x−51
x2x2−5x
-5
4a20af
5f
5af
5a
20f
5642xyz
86xyz
43xyz
86yz
43yz
26x+8
6x+8
3x+8
3x+4
6x+4
44a3b33a2b2
4ab3ab
4a3b
43ab
4ab3
(x+7)(x+7)2
x+7x+7
1
x+71
x+7
18n16mn
98mn
9n8m
98m
9n8
2x28x4
4x3
24x2
4x2
28x2
the mass of the girl is 60 kg her estimate is correct to the nearest 10 kg between what limits does the actual mass girl lie
50.5≤60<70.5
55≤60<65
50≤60<70
The number 43.4 has been rounded to the nearest tenth. Find its lower and upper bounds.
42 ≤ 43 < 44
43.3 ≤ 43.4 < 43.4
43.35 ≤ 43.4 < 43.45
The length and width of a field have been measured as 78m and 35m to the nearest metre. Find the greatest possible amount of fencing needed to surround the field
27
228
226.5
228.5

The sides of the rectangle are measured to the nearest cm. What is the largest area of the rectangle?
15 cm2
19.3 cm
19.25 cm2
11.25 cm2
What is the upper bound and lower bound of 390 grams, measured to the nearest 10 grams?
395 and 385
390.5 and 389.5
400 and 300
400 and 350
The number 10 has been rounded to the nearest whole number. Find its lower and upper bounds
9 ≤ 10 < 10
9.5 ≤ 10 < 10.5
9 ≤ 10 < 11
The number 1000 has been rounded to the nearest 100. Find its lower and upper bounds
950 ≤ 1000 < 1050
950 ≤ 1000 < 1050.1
950 ≤ 1000 < 1051
The weight, w grams, of the bag of sweets is 250 g correct to the nearest 10 g. Find the lower bound and the upper bound of w
245 and 255
249.5 and 250.5
247.5 and 252.5
240 and 260
Zoe’s weight is 62 kg, correct to the nearest kilogram. Anu’s weight is 85 kg, correct to the nearest kilogram.
Work out the upper bound for the difference between Zoe’s weight and Anu’s weight.
20 kg
23 kg
22 kg
24 kg
The length and width of a field have been measured as 78m and 35m to the nearest metre. Find the greatest possible amount of fencing needed to surround the field
27
228
226.5
228.5
A piece of A4 paper is 21.1 cm by 29.7 cm measured to the nearest 0.1cm. What are the lower and upper bounds of its area, in square centimetres, correct to 1 dp?
624.1325 and 629.2125
624.1 and 629.2
624.13 and 629.21
624 and 629
-3 + x ≤ -11
x ≤ -8
x ≤ 8
x ≥ -8
x ≥ 8
2x < -3x + 15
x > 3
x > 15
x < 3
x < 15
6x - 4 ≥ 26
x ≥ 3.67
x ≥ 5
x < 5
x ≤ 5
3x - 2 < 13
x > 3.67
x > 5
x < 5
x < 3.67
2x - 3 ≥ 4x - 1
x ≤ -1
x ≥ -1
x ≤ 1
x ≥ 1
4x - 3 < -1x + 12
x > 3
x < 3
x < 5
x > 5
.5(x - 8) < 2
x > 20
x < 20
x > 12
x < 12
-1(2x + 4) ≥ 6
x ≤ -5
x ≥ -5
x ≤ -1
x ≥ -1
-2x + 2 > 3x - 8
x > -9
x > 2
x < -9
x < 2

What inequality is graphed here?
x > 1
x ≥ 1
x < 1
x ≤ 1

What inequality is graphed here?
x ≤ -2
x < -2
x > -2
x ≥ -2
3(x - 3) ≤ 2(x + 2)
x ≤ -5
x ≥ 5
x ≥ 13
x ≤ 13
Translate: 5 times a number is at least 60.
5x < 60
5x > 60
5x ≤ 60
5x ≥ 60
Translate:
A number increased by 4 is no more than -18.
x + 4 < -18
x + 4 > -18
x + 4 ≤ -18
x + 4 ≥ -18
Translate:
Twice a number is smaller than 42.
2x < 42
2x > 42
2x ≤ 42
2x ≥ 42
Choose the group of numbers that satisfy the inequality:
x < -4
-4, -5, -6
-4.001, -5, -6
5, 6, 7
0, -5, -10

Choose the correct inequality for the graph:
x > 2
x > 2
x < 2
x < 2
Solve the inequality: 3x - 10 > 2
x > 4
x < 4
x > -8/3
x < 8/2
4 - 2x < 14
x < -9
x > -9
x < -5
x > -5
Solve the inequality: -3(x + 2) < 21
x < -9
x > -9
x > 5
x < 5
2(x - 1) + 4x < 10
x > 2
x < 2
x > 11/6
x < 11/6
x + 5 ≤ 13

2−x≤−2
x≤4
x≥4
x≤−4
x≥−4
-4 - 6m > -9m + 8?
Which numbers are possible solutions to the inequality... (SELECT ALL THAT APPLY)
-5x + 10 < 30
0
100
-100
-3
-4
The equation of a straight line is in the form of .....
y=x
y=mx
y=mx+c
y=mx+mc
What is the gradient of the line y=2x-3
(a)

Which of these lines has a negative gradient?
Orange Line
Blue Line
Red Line
Green Line

What is the gradient of this line?
2
½
−2
−½

What is the gradient of the line AD?
⅘
−⅘
1¼
−1¼

Find the y-intercept for the PURPLE line.
−3
4
−2
2
Find the equation of the straight line with slope 2 passing through (-3, 4) .
2x−y−2=0
2x−y−10=0
2x−y+2=0
2x−y+10=0
Find the equation of the straight line with slope -7 and y-intercept 4 .
4x−y−7=0
7x+y−4=0
x−4y+7=0
x+7y−4=0
Find the equation of the straight line passing through A(10, -2) and B(4, 1) .
x+2y−6=0
x+2y−9=0
x+14y+12=0
x+14y+18=0
Straight line 3x−9y−k=0 passes through A(2, 1) . Find the value of k .
-15
-3
3
15
Find the slope of the straight line 2x−6y+9=0 .
-3
−31
31
3
Find the x-intercept and y-intercept of straight line 2x+5y−10=0 .
x-intercept = −52 , y-intercept = 5
x-intercept = −25 , y-intercept = 2
x-intercept = 5 , y-intercept = 2
x-intercept = 5 , y-intercept = 5
Where does the line y=3x+4 cross the y-axis?
3
-4
4
-3
What line goes through (1,4) and has gradient 2
y=2x+2
y=x+1
y=4x-1
y=2x+4
Which line has gradient 2 and passes through the point (2,3)
y=x
y=2x-1
y=x+1
y=2x
When the line is a horizontal (flat), the gradient is _____________ .
Positive
Negative
Zero
Undefined
When the line is vertical, the gradient is _____________ .
Positive
Negative
Zero
Undefined
What is y-intercept?
the x-coordinate of the point where the line cuts the x-axis
the x-coordinate of the point where the line cuts the y-axis
the y-coordinate of the point where the line cuts the x-axis
the y-coordinate of the point where the line cuts the y-axis
P is the point (−2,3) and Q is the point (4,15). Find the gradient of the straight line PQ.
−2
−21
21
2
4x+6y=0
What is the gradient of the straight line above?
32
−32
4
6
__________: A ratio between the measurements of the drawing and of the actual object.
scale drawing
constant of proportionality
scale
unit rate

Determine the scale in the form of 1:n
(a)

Determine the scale used in the form of 1:n
(a)
Sarah draws a scale drawing of an object using certain scale. It is found that the scale drawing is bigger than the object. Which of the following is possible scale used by Sarah?
1 : 1
1 : 2
1 : 21
1 : 210

A house plan is drawn with the scale of 1:400. The length and the width of living room on the plan are 5cm and 4cm respectively. If the living room is shape of a rectangle, what is the actual area, in m2, of the living room?
20
320
200 000
3 200 000
The actual area of a square garden is 400m2. If the garden is drawn using the scale of 1:500, calculate the area, in cm2, of the drawing.
4
8
16
20

The diagram shows a combination of a rectangle JKMN and a triangle KML. If the measurement of the scale drawing of KL is 6.5cm, what is the scale for the drawing?
1 : 21
1 : 2
1 : 20
1 : 200

The diagram is redrawn using the scale of 1:200. Calculate the length of AB, in cm, of the drawing.
2.5
3
5
6
The actual length of a side of a quadrilateral is 49mm. The length of the mentioned side on a scale drawing is 7cm using the scale of 1:n. Calculate the value of n.
107
1070
10700
107000

Based on the diagram, check 2 correct length of JK based on the given scales.
Scale = 1:2
Length of JK = 7.5cm
Scale = 1:1
Length of JK = 15mm
Scale = 1:31
Length of JK = 45cm
Scale = 1:
Length of JK = 0.3m
The actual length of a river is 2km. If the river is drawn on a map scale 1:40 000, find the length, in cm, of the river on the map.
(a)

Diagram (b) is the scale drawing of Diagram (a) using the scale 1:51 . Find the value of y.
(a)

State the sclae of the scale drawing
(a)

Calculate the area, in cm2 , of the triangle in its scale drawing drawn according to a scale of 1:31 .
(a)
Which calculation would determine the coordinates of the midpoint of the segment that connects
(−2,7) and (6,−5)
(2−2+6,27+−5)
(2−2+7,26+−5)
(2−2+−5,27+6)
(−2+6,7+−5)
Complete the question to determine the coordinates of the midpoint of the segment that connects
(−2,7) and (6,−5)
(2,1)
(25,21)
(−27,213)
(4,2)
What formula is the midpoint formula?


The endpoints of segment CD are C (3, -5) and D (7, 9). Find the coordinates of the midpoint?
(3, 5)
(5, 2)
(6,8)
Find the midpoint of the segment with the following endpoints:
(-9, 2) & (-5, -6).
(-7, -2)
(2, -7)
(-9, -5)
(2, -6)
The midpoint M and one endpoint of segment GH is given. Find the coordinates of the other endpoint. G(5, -6) and M(4,3).
(3, 12)
(6, 4)
(1, 2)
The midpoint M and one endpoint of segment GH is given. Find the coordinates of the other endpoint. G(-3, 7) and M(-2,5).
(6, 8)
(-1, 3)
(2, -4)
The midpoint M and one endpoint of segment GH is given. Find the coordinates of the other endpoint. G(-2, 9) and M(8, 0).
(-6, 0)
( 6, 9)
(18, -9)
What formula is the distance formula?
Find the distance between the following points:
(1,4) & (4,0)
10
5
25
30
Find the distance between the two points:
(-3,-1) & (-2,4).
2
3
10
26
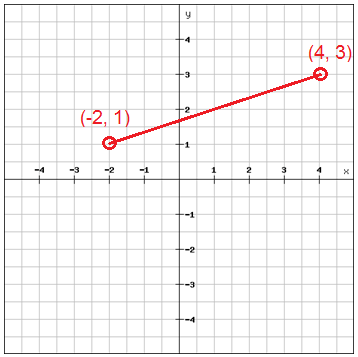
What is the distance between the two points?
210
4
410
102
The Endpoints of RN are R(0,4) and N(-2,-3). Find the Distance
Choose 2
8
7.28
53
2.83
Write the equation of a line PARALLEL to y = 2x + 3 that passes through the point (3, 1).
y=2x −3
y=2x−5
y=2x + 1
y=−21x+25
Write the equation of a line PERPENDICULAR to y = -2x + 1 that passes through the point (2, 3).
y=−21x+21
y=21x+2
y=−2x+7
y=−2x+8
Select the two lines that are parallel.
y=4x−2
y=−41x
y=−4x+1
None are parallel.
y = -4x + 6 (2, -1)
y = 3x + 2 (3, -4)
y=4x-2
y-3=-1/4(x-8)
Which of the following equations has a graph PARALLEL to the line y = 4x + 7 and has an y-intercept of -2?
y=4x−2
y=4x+8
y=41x−2
y=−41x−2

A line is perpendicular to y = 2x + 4
What is the slope of this line?
-2
1/2
-1/2
2
Level 3
Which two equations below are parallel?
y = 2x + 1 and y = -1/2x + 1
y = 2x + 3 and y = -2x + 3
y = 2x - 1 and y = 1/2x - 1
y = -x + 4 and y = -x + 2
Level 3
Which two equations below are perpendicular?
y = -3x + 2 and y = -2x + 2
y = 3x + 1 and y = 3x + 1
y = -x + 1 and y = -x - 2
y = 3x - 4 and y = -1/3x - 2
y = 3x - 6 and passes through the point (15,5).
y = x - 5 through (1, -2)
y = 2/7x - 5 through (2, -3)
y = -5x + 3 through (-5, -4)
Solve:
3x - y = 11
x + y = 5
x = 4
y = 1
x = 4
y = -1
x = -4
y = 1
x = -4
y = -1
Solve:
2x + 3y = 5
x + 3y = 7
x = -2
y = 3
x = -2
y = -3
x = 2
y = 3
x = 2
y = -3
Solve:
2x + 5y = 29
x + 5y = 22
x = 7
y = 3
x = -7
y = -3
x = 7
y = -3
x = -7
y = 3
Solve:
3x + 5y = 4
4x - 5y = -18
x = -2
y = 2
x = -2
y = -2
x = 2
y = -2
x = 2
y = 2
Solve:
3x - 4y = 26
2x - 4y = 20
x = 6
y = -2
x = -6
y = -2
x = -6
y = 2
x = 6
y = 2
Solve:
2x + y = 16
4x - y = 2
x = 3
y = 10
x = -3
y = -10
x = -3
y = 10
x = 3
y = -10
Solve:
4x - y = 17
7x - y = 32
x = 5
y = 3
x = -5
y = 3
x = 5
y = -3
x = -5
y = -3
Solve:
3x + 2y = 15
7x + 2y = 19
x = 1
y = 6
x = -1
y = 6
x = 1
y = -6
x = -1
y = -6
Solve for (x,y)
-2x + 6y = 16
-4x - 3y = 2
(2,2)
(-2, -2)
(-2,2)
(2,1)
Solve for (x,y)
5x + y = 9
10x − 7y = −18
(-4,-1)
(-1,-4)
(4,1)
(1, 4)
Solve by substitution:
2x−3y=−1
y=x−1
(3, 4)
(4, 3)
(4, 4)
(3, 3)
Solve by elimination:
−6x+6y=6
−6x+3y=−12
(-5, 6)
(5, -6)
(-5, -6)
(5, 6)
Solve by elimination:
−2x−9y=−25
−4x−9y=−23
(-1, -1)
(-1, 3)
(3, -3)
(-3, 3)
Solve by elimination:
5x+y=9
10x−7y=−18
(4, 1)
(-1, 4)
(1, 4)
(4, -1)
Solve by elimination:
−4x+9y=9
x−3y=−6
(9, 5)
(-9, 5)
(9, -5)
(-9, -5)
True or false?
Scatter plots have lines joining their dots.
True
False

This scatter plot shows that as the temperature goes up the number of pies sold:
goes up
goes down
stays the same

You can see that as students get older, they do:
more hours of homework
fewer hours of homework
the same hours of homework as when they were younger

True or false?
This scatter plot tells you that as temperature increases, sales of cold drinks also increase.
True
False

Which type of relationship does this scatter plot show between student age and hours of homework?
No relationship
A positive relationship
A negativ relationship

True or false?
This scatter plot shows a clear relationship between the time spent watching television and the distance a student lives from school.
True
False
When there is no relationship between the two sets of data on a scatter plot, the diagram will show:
randomly scattered dots
dots going up from left to right
dots going down from left to right

The scatter plot shows that:
the newer a motor vehicle, the higher its selling price
the newer a motor vehicle, the lower its selling price

This scatter plot relates the number of pens in students' pencil cases to the number of sandwiches in their lunchboxes.
Choose the correct word/s to complete the statement.
The scatter plot shows there is ____________ relationship between the number of pencils student carry and the number of sandwiches in their lunchboxes.
a positive
a negative
no

Ethan surveyed two canteens and plotted their sunscreen sales against their sales of cold drinks.
Choose the correct statement using data from the diagram.
As sales of cold drinks increase, sunscreen sales:
decrease
do not change
increase

Luke’s maths result was very good but his English result was very poor. Which dot is most likely to represent his results?
A
B
C
D

Areej got a very poor maths result but a very good English result. Which dot is most likely to represent her results?
A
B
C
D
Which diagram shows a negative relationship between Factors A and B?


Which diagram shows that as Factor A increases, Factor B also increases?


Choose the correct word/s to complete this statement.
This scatter plot shows that there is _______________ relationship between motor vehicle age and selling price.
a positive
a negative
no
Which graph shows that Factor B remains unchanged as Factor A increases?


Stefan’s mark for Maths was the same as his mark for English. Which dot is most likely to represent his results?
A
B
C
D

Choose all the statements which correctly describe this scatter plot.
There is a strong positive relation between the two sets of marks.
Students who did well in history did not do as well in art.
There is a strong negative relation between the two sets of marks.
Students who did well in history also did well in art.
Answer
Which of the following plots shows the strongest negative relation between the two sets of data?


Which of these scatter plots shows the weakest relationship between the two sets of data?


Which of the following diagrams shows a weak positive relationship between the two sets of data?


If you plotted the sales of raincoats each day against the amount of rain falling each day you could expect:
a strong negative relationship
a weak negative relationship
no relationship
a positive relationship
A strong positive relationship between two sets of data means that as there is an increase in one, there is:
a decrease in the other
a definite increase in the other
no obvious increase or decrease
a definite decrease in the other
Answer

Use the line of best fit to estimate the chemistry mark for a student who obtained a mark of 90 in mathematics.
Chemistry mark estimate is ...
(a)
Which graph shows the best trend line for this data?



