
 Worksheets
pictograph
Total questions: 20
Worksheet time: 1hrs 18mins
Name
Class
Date
1.

A graph that uses pictures to show and compare information
a)
frequency table
b)
line plot
c)
picture graph
d)
scale
2.

The part of a map or graph that explains the symbols
a)
vertical bar graph
b)
scale
c)
line plot
d)
key
3.

How many people liked Mickey Mouse best?
a)
4
b)
10
c)
5
d)
6
4.

What is the title of the graph?
a)
Number of people
b)
Character
c)
Favorite Cartoon Characters
d)
Sponge Bob
5.

How many total votes were collected?
a)
5
b)
10
c)
15
d)
20
6.

How many students like strawberries the best?
a)
2
b)
40
c)
20
d)
10
7.

How many more people like the color purple than blue?
a)
1
b)
3
c)
6
d)
8
8.

How many students like Spring the best?
a)
25
b)
50
c)
45
d)
60
9.

Which fast food is the most liked?
a)
hot dog
b)
hamburger
c)
chips
d)
pizza
e)
nuggets
10.

Which school lunch is the most popular?
a)
Pizza
b)
Chicken Nuggets
c)
Breakfast
d)
None
11.

Which topping was more popular? Cheese or sausage?
a)
Cheese
b)
Sausage
c)
They were equally popular
d)
Neither one was popular
12.

How many students favorite pet was a cat?
a)
5
b)
10
c)
4
d)
15
13.
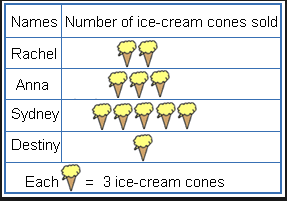
How many cones were sold in all?
a)
16
b)
21
c)
11
d)
33
14.

How many apples were sold in March?
a)
24
b)
25
c)
30
d)
20
15.

Which fruit has the least votes?
a)
Grapes
b)
Apples
c)
Banana
d)
Pear
16.

How many children joined the Dance Club?
a)
3
b)
7
c)
9
d)
10
17.

What is the title of this graph?
a)
Favorite Cake Flavor
b)
Favorite Class
c)
Favorite Juice
18.

Who ate the most Cheeseburgers?
a)
Micheal
b)
Jacob
c)
Sara
d)
Tara
19.
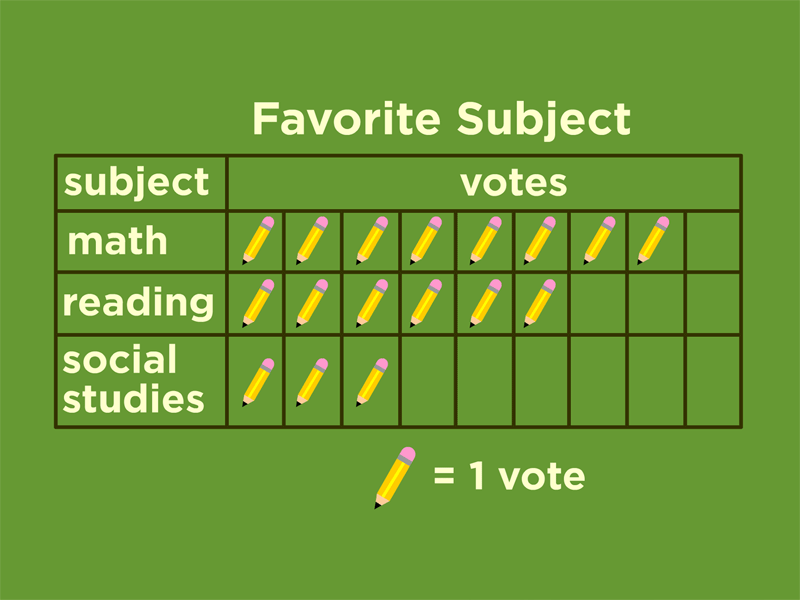
What does each pencil equal?
a)
3
b)
1
c)
2
20.

How many tractors were on Village A and B?
a)
19
b)
11
c)
10
d)
9
100 %

