
 Worksheets
DVISANLY_Week5
Total questions: 10
Worksheet time: 4mins

How confident are you in using Tableau to create statistical charts like box plot, histogram and scatter plot?
I'm confident in this topic
This topic is new to me
I love this topic
I'm not sure I know much about this topic
I'd like to ask some clarifying questions about this topic
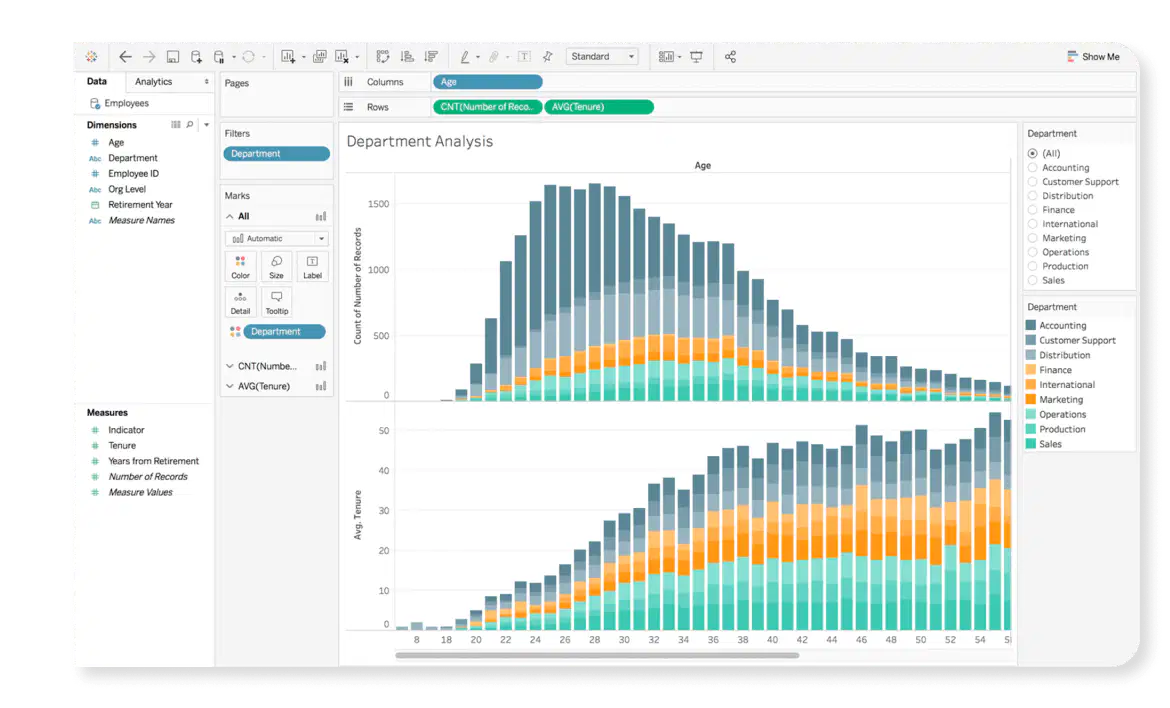
Which of the following is NOT correct about Tableau?
Tableau only reads Excel files.
Tableau creates visual charts.
Tableau files are called workbooks
Tableau files are saved with extensions .twb

This set of fields are called "Measures"

True

False
What is "Aggregate Measure"?
It performs some functions on all values
It splits up the values into points
It shows a bar chart
It measures aggreates
Data type for Data Analysis can be classified into Numerical and ________ data type.
Nominal
Dimension
Categorical
String
Which of the following visual chart(s) are good to show the central tendency and spread of a set of values?
Scatter Plot
Box Plot
Histogram
Pie Chart
A scatter plot shows the spread of univariate analysis.

True

False

Which of the following is NOT true about a Histogram?
A Histogram is a bar chart of a Frequency Distribution
The range of values with the highest count is called Mode
The total number of observations is the sum of all the frequency count
Histogram is part of Omnivariate analysis
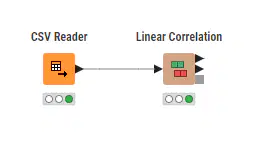
KNIME program uses a _______ to represent a function.
Mode
Node
Workflow
Repository
Which of the following node will you use to read a CSV file in KNIME?

Line Reader

Table Reader

CSV Reader

Excel Reader

