
 Worksheets
Creative Development and Data | Quiz 2
Total questions: 10
Worksheet time: 15mins
Oil tankers are prone to fire, due to all the gasoline on the ship. Some tankers use specialized cameras for flame and smoke detection and install them in the most fire-prone spots of the ship. The cameras record videos whenever they detect motion, and also record data about the videos themselves, including the location of the camera, the temperature near the camera, the start date/time of the recording, and the end date/time of the recording. Which of these questions can be better answered by analyzing the videos' data instead of the recorded videos? There are exactly two correct answers.
What is the range in temperature at the cameras?
What is the direction of the smoke for a video?
What proportion of the video contains flames?
On average, how many recordings are made each day per camera location?
Hong is a research director for NASA. She is hoping to build a system that can process millions of images from satellites orbiting the earth and analyze them each day for signs of deforestation and ocean debris. She decides to hire an engineer specifically for the task of building the system and reviews many résumés. Which of these lines on a résumé is most pertinent to this task?
"I have implemented multiple encryption systems."
"I have experience with anonymizing personal information in databases."
"I write highly modular code."
“I have experience building highly scalable systems.”
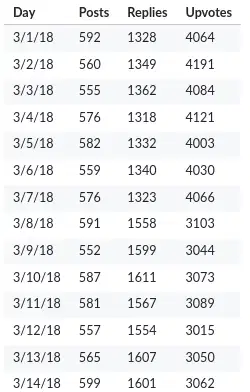
A website for sports fans includes a discussion forum for fans to discuss games, athletes, and predictions for the coming seasons. They decide to redesign their discussion forum to be more usable and modern looking, and ask the data analysis team to analyze the effect of the redesign on usage statistics. The website released the redesign on 8 March, 2024. This table shows daily usage data before and after the redesign, including number of posts created, number of replies, and number of upvotes on posts. Which hypothesis is most consistent with the data?
The redesign led to a significant increase in replies but a decrease in upvotes.
The redesign led to an increase in posts created but had no effect on replies.
The redesign led to a significant increase in posts created and replies.
The redesign led to a decrease in upvotes but had no effect on replies.

Two neighboring high schools both offer an AP Biology course and track how well the students do on the exam. The high schools store the data in these formats. The two schools decide to combine their data sets to see what they can learn from them together. Which of the following can be determined from the combined data set? There are exactly two correct answers.
The mean number of study hours for students that earned a 5
The total number of students that earned either a 4 or a 5
The correlation between class score and AP exam score
The distribution of AP exam scores for 11th graders
Lakeisha is developing a program to process data from smart sensors installed in factories. The thousands of sensors produce millions of data points each day. When she ran her program on her computer, it took 10 hours to complete. Which of these strategies are most likely to speed up her data processing? There are exactly two correct answers.
Figuring out a way to write the program in less lines of code
Distributing the computing to multiple machines to run the program on subsets of the data
Using parallel computing on a computer
Encrypting the data with a symmetric encryption technique before processing it
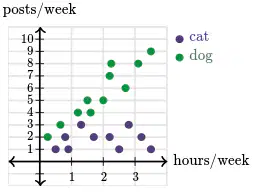
An online website for pet lovers provides articles written by veterinarians on health and nutrition, plus a community forum for discussions and photo sharing. The website developers are curious to see if there are usage patterns in how pet owners use the site, and are especially curious to see if there is a difference between dog owners and cat owners. This scatter plot compares the weekly hours spent on the site by a user to the number of forum posts they made that week. The green dots represent dog owners and the purple dots represent cat owners. Which hypothesis is most consistent with the chart?
The more that dog owners use the site, the more forum posts they make.
Dog owners generally make less forum posts than cat owners.
The more that cat owners use the site, the more forum posts they make.
Cat owners generally makes more forum posts than dog owners.
The San Francisco Health Department keeps track of health inspections at restaurants and makes the data publicly available. Each row in the inspections data set contains these details:
-Restaurant name
-Restaurant address
-Inspection date
-Inspection score (0-100)
-Violation description
-Risk severity (low/medium/high)
Which of the following questions can be answered using the available data? There are at least two correct answers.
How many restaurants have an inspection score greater than 90?
What is the median inspection score for the high risk violations?
Which restaurant has the lowest inspection score?
Which type of restaurant has the most high risk violations?
Talisa is an engineer that is helping a museum to digitize and analyze all of its historical books. After running the software over the first 100 books, she realizes that the museum computer has run out of space to store the digital files. Which technique is the most needed to help them digitize the remaining books?
software documentation
software modularity
parallel computing
distributed computing
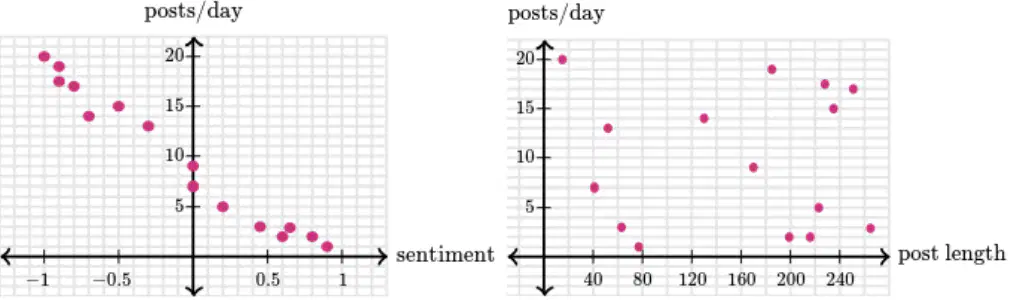
Craig is developing a new micro-blogging app and has shared it with a group of beta testers. He needs to understand their usage patterns, so he tracks data on the number of posts a user makes each day, the mode length of their posts, and the mean sentiment of their posts (from very negative to very positive). The plot (left) compares the mean sentiment for a user's posts to the number of posts they make each day. The plot (right) compares the mode length of a user's posts to their number of posts each day. Which conclusion can Craig make from the data?
There is a negative correlation between posts per day and sentiment.
When users post more each day, they tend to write shorter posts.
There is a positive correlation between posts per day and sentiment.
Posting more times each day causes a user to write more negative posts.

StackOverflow is a popular questions & answers site. Each time a user asks a new question, they insert a row in a database table. Each row contains:
-The user ID
-The user display name
-The timestamp of the question
-The text of the quesiton
-The spam score of a question (0-5)
Here are a few rows from the table. The team needs to display question statistics on an internal dashboard. Which statistic CANNOT be calculated from the table of questions?
The user ID whose questions have the highest spam scores
The user ID with the most number of unanswered questions
The proportion of questions that have a spam score of 3 or higher
The most recently asked question

