
 Worksheets
Motion Graphs
Total questions: 25
Worksheet time: 24mins
Name
Class
Date
1.
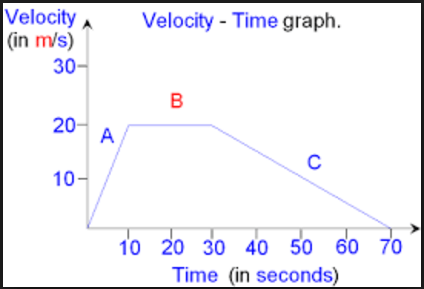
This is a velocity-time graph. What is the object doing in segment C?
a)
Positive acceleration
b)
Negative acceleration
c)
Constant Velocity
d)
Not moving
2.

What is happening at E?
a)
Stationary
b)
Accelerating
c)
Fast steady speed; moving away from the starting position
d)
Steady speed; returning to start position
3.

Which runner won the race?
a)
A
b)
B
c)
C
4.

What does this graph represent?
a)
Constant Speed
b)
Acceleration
c)
Not moving
5.

What does this graph represent?
a)
Constant speed
b)
Acceleration
c)
Not moving
6.
In which of the following graphs below are both runners moving at the same speed?
a)
b)
c)
d)
7.

Object is...
a)
(1) speeding up,
(2) constant speed,
(3) speeding up
b)
(1) constant speed.
(2) stopped,
(3) constant speed
8.

Object ...
a)
accelerates... then goes constant speed... then accelerates again
b)
goes constant speed... stops... goes constant speed
9.
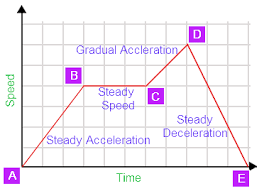
At what point is the speed the greatest?
a)
C-D
b)
B-C
c)
A-B
d)
D-E
10.
Acceleration occurs when an object changes its speed or ______.
a)
direction
b)
force
c)
inertia
d)
mass
11.

Which runner stopped for a rest?
a)
Albert
b)
Bob
c)
Charlie
12.

How long did one of the runner's rest?
a)
8 seconds
b)
13 seconds
c)
5 seconds
d)
50 seconds
13.

Which runner won the race?
a)
Albert
b)
Bob
c)
Charlie
14.
Velocity is
a)
speed and acceleration
b)
constant speed
c)
a frame of reference
d)
speed in a given direction
15.
Acceleration is
a)
increasing speed
b)
decreasing speed
c)
changing direction
d)
all of the above
16.
A car driving at 50 miles per hour drives for 2 hours. What distance did it cover?
a)
50 miles
b)
25 miles
c)
100 miles
d)
75 miles
17.
What does this graph represent?
a)
Constant Speed
b)
Acceleration
c)
Not moving
18.
What does this graph represent?
a)
Constant speed
b)
Acceleration
c)
Not moving
19.
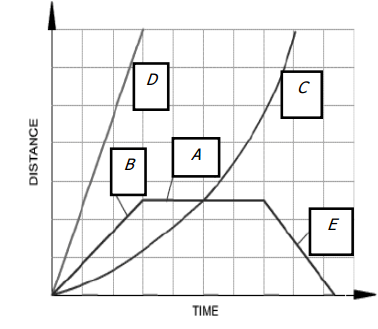
What is happening at E?
a)
Stationary
b)
Accelerating
c)
Fast steady speed; moving away from the starting position
d)
Steady speed; returning to start position
20.

Every morning, Tom walks along a straight road from his home to the bus stop. Below, is a graph representing Tom’s trip to school.
- What is the distance covered through the second segment, which is between 50 seconds, and 70 seconds?
- What is the distance covered through the second segment, which is between 50 seconds, and 70 seconds?
a)
40 meters
b)
60 meters
c)
80 meters
d)
20 meters
21.
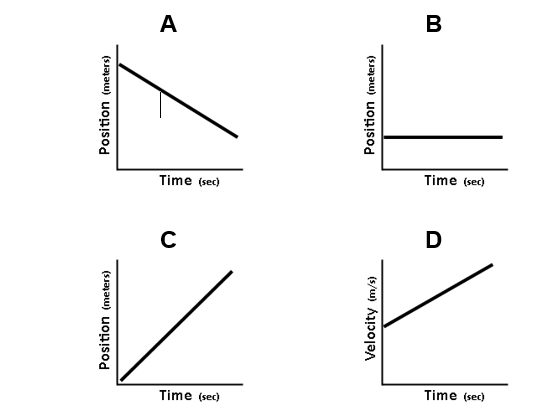
Which graph shows the object standing still?
a)
A
b)
B
c)
C
d)
D
22.
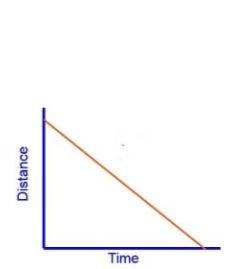
What is this line of this graph showing?
a)
moving away from starting point at a constant speed
b)
moving back towards the starting point at a constant speed
c)
acceleration (getting faster)
d)
deceleration (getting slower)
23.

During which interval is the object speeding up?
a)
A to B
b)
B to C
c)
D to E
d)
E to F
24.

This graph demonstrates an object that is -
a)
At a constant speed
b)
Increasing speed
c)
Decreasing speed
d)
Stationary
25.

This graph demonstrates an object that is -
a)
At a constant speed
b)
Increasing speed
c)
Decreasing speed
d)
Stationary
100 %

