
 Worksheets
Stock Trading Patterns
Total questions: 20
Worksheet time: 10mins
What is a bullish flag pattern in stock trading?
A pattern that signals a reversal from an upward trend to a downward trend
A pattern that suggests a stock price will remain stagnant indefinitely
A bullish flag pattern in stock trading is a continuation pattern that signals a temporary pause before the stock price resumes its upward trend.
A bearish pattern indicating a downward trend
Can you provide an example of a stock that exhibited a bullish flag pattern?
Apple Inc. (AAPL)
Microsoft Corporation (MSFT)
Amazon.com Inc. (AMZN)
Tesla Inc. (TSLA)
How can traders identify a bearish flag pattern on a stock chart?
Wait for the stock to break above the consolidation period
Identify a triangular shape forming on higher volume
Look for a sharp price increase followed by a consolidation period
Look for a sharp price decline (flagpole) followed by a consolidation period forming a rectangular shape (flag) on lower volume.
What is the significance of volume in confirming a bullish flag pattern?
Volume has no impact on confirming a bullish flag pattern
Volume indicates the bearish nature of the flag pattern
Volume confirms the strength of the bullish flag pattern.
High volume suggests a weakening bullish flag pattern
Explain how traders can set a price target when trading a bullish flag pattern.
Measure the length of the flagpole and project that length from the breakout point.
Close your eyes and point to a spot on the chart for the price target
Use a random number generator to determine the price target
Ask a friend to guess the price target
What are the key characteristics of a bearish flag pattern?
Reversal of the downward trend
Sharp price move downwards, consolidation forming a flag shape, continuation of the downward trend
Formation of a triangle shape
Gradual price move upwards
Describe a real-life scenario where a bearish flag pattern led to a significant price decline in a stock.
A bearish flag pattern in Company X's stock after a prolonged downtrend resulted in a significant price decline.
A bearish flag pattern in Company X's stock after a prolonged uptrend resulted in a significant price increase.
A bearish flag pattern in Company Y's stock after a prolonged uptrend resulted in a significant price decline.
A bullish flag pattern in Company X's stock after a prolonged downtrend resulted in a significant price decline.
How does the duration of a flagpole impact the reliability of a bullish flag pattern?
A longer duration of a flagpole generally increases the reliability of a bullish flag pattern.
A shorter duration of a flagpole generally increases the reliability of a bullish flag pattern.
The duration of a flagpole has no impact on the reliability of a bullish flag pattern.
A longer duration of a flagpole generally decreases the reliability of a bullish flag pattern.
Discuss the role of market sentiment in the formation of a bearish flag pattern.
Market sentiment leads to a bullish flag pattern instead of a bearish one
A bearish flag pattern is solely determined by technical indicators
Market sentiment has no impact on the formation of a bearish flag pattern
Market sentiment influences the formation of a bearish flag pattern by creating a negative bias among traders, leading to a temporary consolidation before a continuation of the downtrend.
Why is it important for traders to wait for a breakout confirmation before entering a trade based on a bullish flag pattern?
To test their luck and see if the pattern holds true
To increase the chances of catching the peak price
To follow the crowd and not miss out on potential gains
To confirm the price movement direction and reduce the risk of false signals and potential losses.
What are some common mistakes that traders make when identifying a bearish flag pattern?
Misinterpreting consolidation as a bearish flag, not waiting for breakout confirmation, incorrect measurement of flagpole or flag
Using a different chart pattern to identify a bearish flag
Ignoring the flagpole entirely
Assuming the pattern will always result in a bearish trend
Explain the concept of a 'measured move' in relation to a bullish flag pattern.
A measured move in relation to a bullish flag pattern is a potential price target calculated by measuring the initial flagpole's distance and adding it to the breakout point of the flag pattern.
A measured move is a bearish pattern indicating a potential price drop in the market.
A measured move is a term used to describe the distance between two moving averages in technical analysis.
A measured move is a strategy where traders randomly select entry and exit points without any analysis.
How can traders manage risk when trading a bearish flag pattern?
Ignoring the pattern and continuing to hold the position
Moving the stop-loss order above the flag pattern's upper trendline
Doubling the position size to take advantage of the bearish trend
Setting stop-loss orders below the flag pattern's lower trendline and reducing position size.
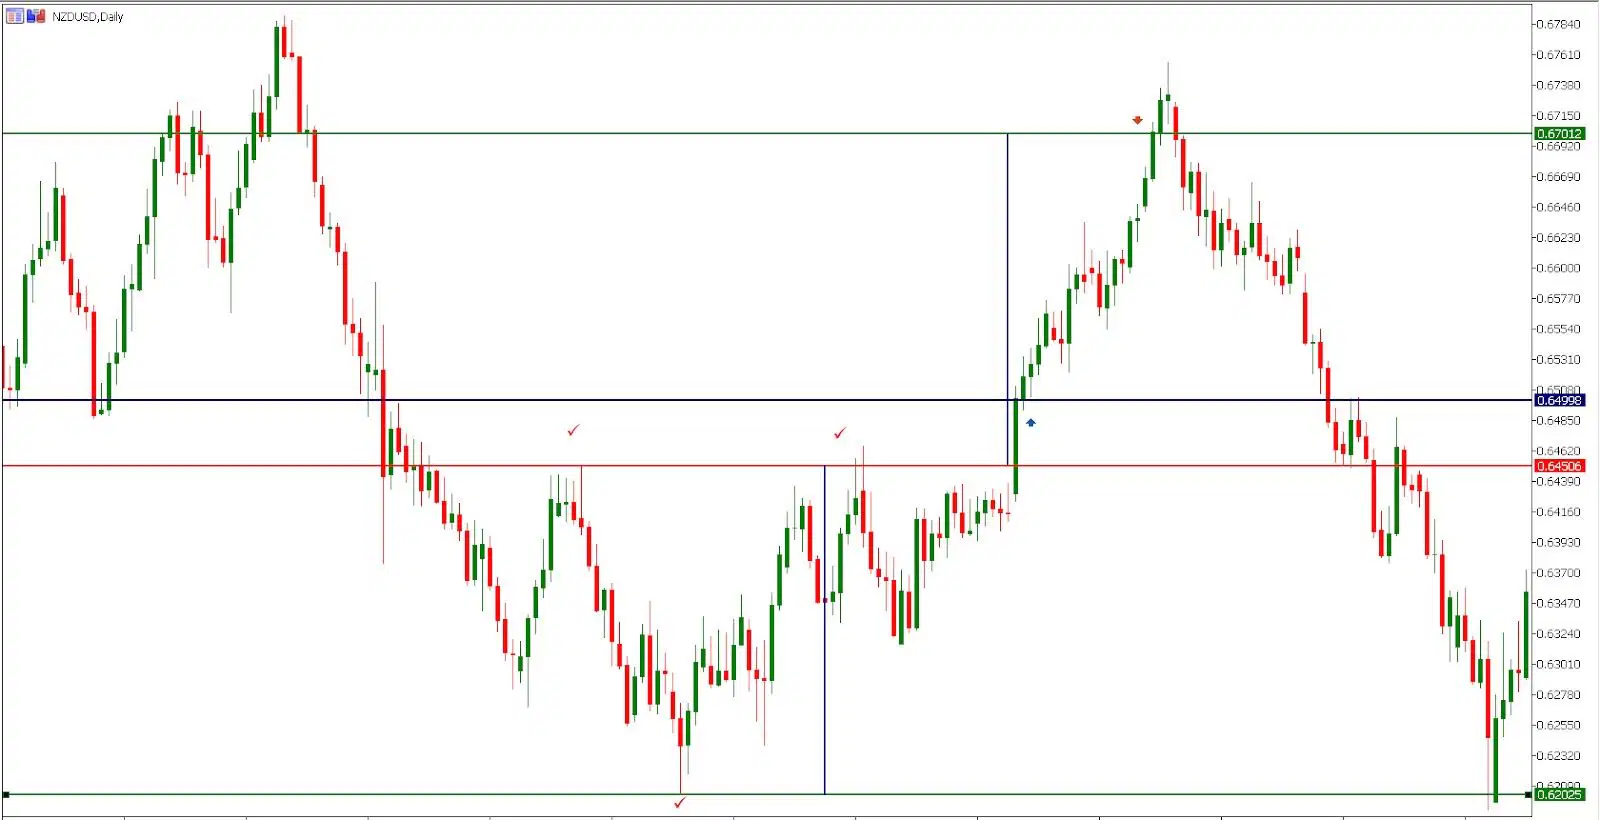
Label the chart
Inverse head and shoulders
Cup and handle
Head and shoulders
Wedge

label the chart
Bearish flag
Reverse head and shoulders
Cup and handle
Gravestone doji

The dojis that are circled in blue hint that the market may be doing which of the following?
Rejecting price continuing in a bearish direction and price may be heading for a bullish move.
Rejecting price to a bullish direction and price may be heading toward a bearish move.
Price is in an area of indecision
Price will be staying in that area and the market is consolidating.
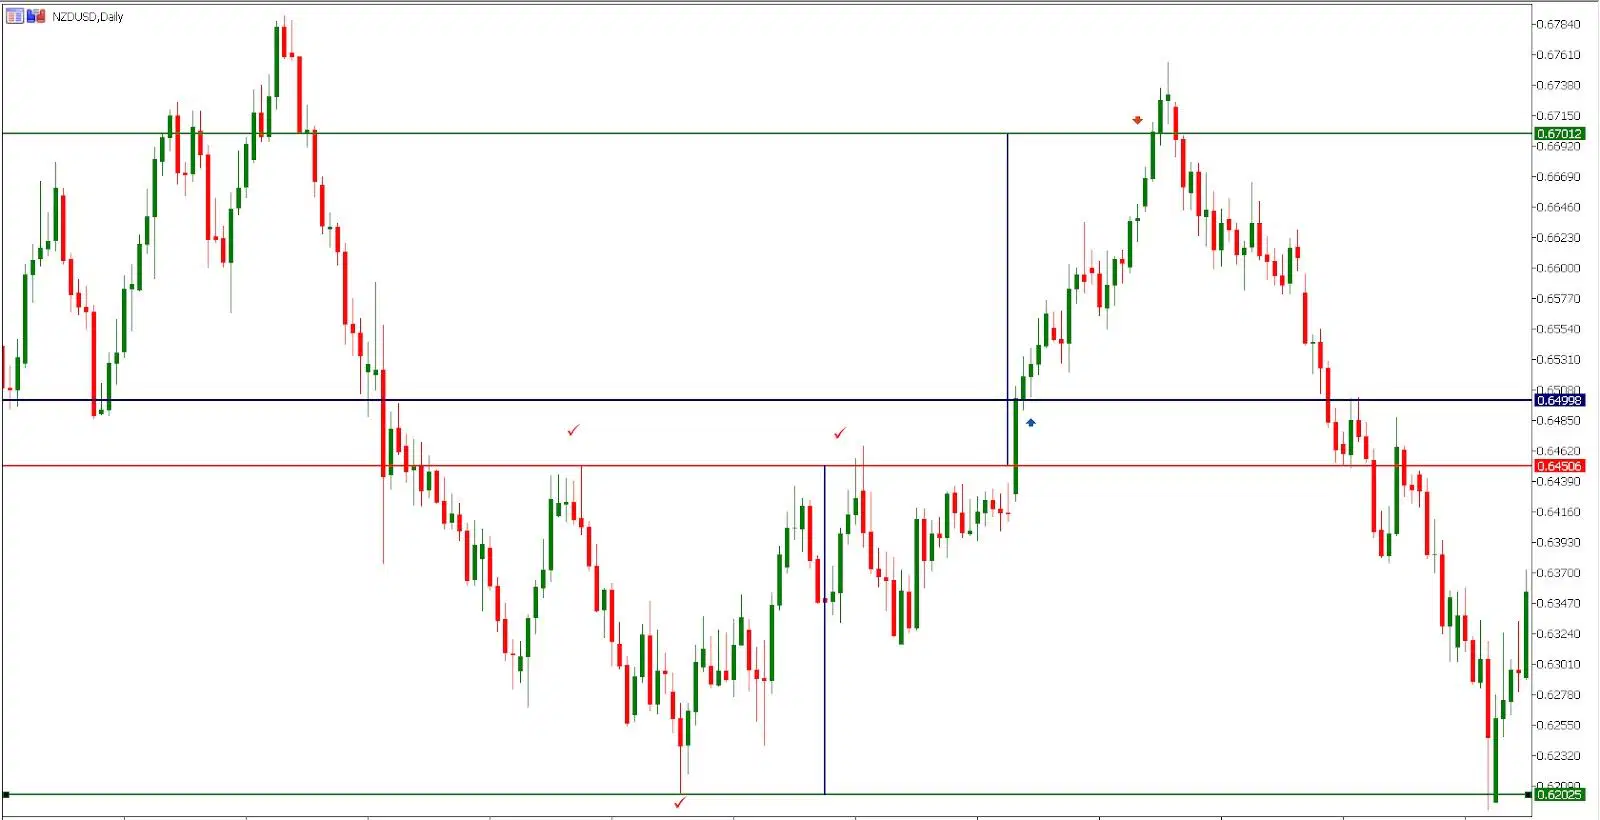
Label the chart
Cup and handle
Bull flag
Reverse head and shoulders
Accending triangle

Label the chart
Decending triangle
Bull Pennet
Double bottom
Accending triangle

Label the chart
Triple bottom
Bearish flag
Reverse head and shoulders
Bearish bat
If the stock started at $1, and spiked to $3, then rotated float 10 times, you can bet that most of the long positions are in around ____ Below a point they are all going to sell.
2.5
3
1
2

