wayground logo

Free Printable Worksheets

Font size

S
M
L
XL
Worksheets

Capstone Review: Data, Statistics and Probability (DSP)

Total questions: 83

Worksheet time: 4hrs 40mins

Name
Class
Date
1.

Match the following types of data displays:

a)
1.

Dot Plot

b)
2.

Histogram

c)
3.

Frequency Table

d)
4.

Scatter Plot

e)
5.

Box and Whisker Plot

2.

The bin sizes​ in a ​ (a)   must be ​ (b)   .

Choose from the below words
histogram
the same
dot plot
frequency table
box and whisker plot
scatter plot
different
whatever size you want
3.

You do not know that exact values of the individual data points with this type of display:

a)

Frequency Table

b)

Dot Plot

c)

Histogram

d)

Scatter Plot

4.

Match the following types of data displays:

a)
1.

Dot Plot

b)
2.

Histogram

c)
3.

Frequency Table

d)
4.

Scatter Plot

e)
5.

Box and Whisker Plot

5.

The bin sizes​ in a ​ (a)   must be ​ (b)   .

Choose from the below words
histogram
the same
dot plot
frequency table
box and whisker plot
scatter plot
different
whatever size you want
6.

You do not know that exact values of the individual data points with this type of display:

a)

Frequency Table

b)

Dot Plot

c)

Histogram

d)

Scatter Plot

7.

Match the following:

a)

Dot Plot

1.

Stack multiples across a row.

b)

Scatter Plot

2.

Two pieces of data are compared on a graph.

c)

Histogram

3.

Touching bars that show how many in a bin.

d)

Box and Whisker Plot

4.

Breaks data into quarters.

e)

Frequency Table

5.

Tallying up results to count occurrences.

8.

Match the following:

a)

Mean

1.

Average

b)

Mode

2.

Most Often

c)

Median

3.

Middle Number

d)

Range

4.

Difference between Highest and Lowest Points.

9.

A ​ (a)   can be used to make several other data displays.

Choose from the below words
frequency table
dot plot
histogram
box and whisker
10.

What type of data display can you find the exact values of the points? (pick all that are correct)

a)

Histogram

b)

Dot Plot

c)

Scatter Plot

d)

Box and Whisker Plot

11.

Which dot plot shows the same data as this histogram?

a)
b)
c)
12.

Which bin shows the greatest number of pets?

a)

15-19

b)

0-4

c)

5-9

d)

10-14

13.

A ​ (a)   is a graphical display of data using dots.

A ​ (b)   is a graphical display where the data is grouped into ranges.

Choose from the below words
dot plot
histogram
box plot
frequency table
scatter plot
14.

The (a)   is the difference between the lowest and highest values.

Choose from the below words
range
mean
median
mode
15.

The (a)   is the number which appears most often in a set of numbers.

Choose from the below words
mode
range
median
mean
16.

The (a)   is the average of the numbers.

Choose from the below words
mean
mode
range
median
17.

The (a)   is the middle number (in a sorted list of numbers).

Choose from the following: mean // median // mode // range

18.
How many employees are there that make between $33,000 and $43,000
a)
250
b)
500
c)
550
d)
750
19.
How many employees are there that make between $33,000 and $43,000
a)
250
b)
500
c)
550
d)
750
20.
How many employees are there that make between $33,000 and $43,000
a)
250
b)
500
c)
550
d)
750
21.
Elliot says almost everyone arrived at the party after 10:00 P.M., but Nancy thinks most people came earlier. When did a majority of the people arrive? 
a)
7:00-7:59 P.M.
b)
8:00–8:59 P.M.
c)
9:00–9:59 P.M.
d)
10:00–10:59 P.M. 
22.
What is incorrect about the following histogram?
a)
The intervals are too small
b)
The intervals overlap
c)
The graph does not start at 0
d)
The axes are not labeled.
23.
Mr. Semo is making a histogram to show the scores on the last science test. He first lists the scores in a stem-and-leaf plot. How many units tall should the bar be for the interval 70-79?
a)
2
b)
5
c)
9
d)
11
24.
Raul measured the heights of the apple trees in an orchard.
What percent of the trees are 5-9 feet tall?
a)
18.9%
b)
31%
c)
22.1%
d)
10%
25.
How many students have more than 1,000 songs on their MP3 player?
a)
5
b)
16
c)
10
d)
4
26.
What percent of students have less than 1,000 songs on their MP3 players?
a)
15%
b)
80%
c)
20%
d)
45%
27.
Charlene made a line plot to graph the ages of employees in an outdoor advertising company Suppose Charlene wants to display this data in a histogram with the bars labeled in the following ages: 20–24, 25–29, 30–34, and 35–39. How tall will the 25–29 bar be? 
a)
10
b)
11
c)
12
d)
14
28.
Which kind of graph is this?
a)
Bar graph
b)
histogram
29.
This is a histogram
a)
true
b)
false
30.
Is a histogram the same as a bar graph?
a)
Yes
b)
No
31.
About how many students from BOTH grades earned $600 or more?
a)
9
b)
16
c)
17
d)
24
32.
What is the total number of parks?
a)
46
b)
16
c)
48
d)
52
33.
How many cities have a monthly temperature of less than 80 degrees?
a)
22
b)
38
c)
26
d)
28
34.
Which interval shows the greatest number of pets?
a)
15-19
b)
0-4
c)
5-9
d)
10-14
35.
25. How many of the students had an ACT composite score less than 30?
a)
5
b)
9
c)
20
d)
26
36.
21. How many students are represented by the histogram?  
a)
Cannot be determined
b)
9
c)
31
d)
35
37.
Which interval has 12 trees planted?
a)
20-29
b)
40-49
c)
0-59
d)
0-19
38.
What is the difference in the number of parks that had the most trees planted and the least trees planted?
a)
13
b)
10
c)
6
d)
3
39.
How many men had finishing times between 60 and 64 minutes?
a)
9
b)
0
c)
7
d)
5
40.

Which of the following is an example of categorical data?

a)

Height

b)

Number of Credits Earned

c)

Grade in School

d)

Grade Point Average

41.

Which of the following is an example of a quantitative variable?

a)

Supervising Manager

b)

Hours Worked

c)

Pay Scale Group

d)

Certification

42.
What does this symbol represent?
a)
Standard Deviation
b)
Variance
c)
Mean Absolute Deviation
d)
Sigma
43.

Which of the following is a measure of spread, or variability?

(select all that apply)

a)

Interquartile Range

b)

Standard Deviation

c)

Mean

d)

Median

e)

Range

44.

What does standard deviation represent?

a)

How many different variations are in the data set.

b)

How the population varies compared to the sample.

c)

How spread out each data value is from the mean.

d)

The range, but with a bunch of other stuff going on.

45.
All of the below sets have the same mean.
Set 1-Standard Deviation=3.1
Set 2-Standard Deviation=4.9
Set 3-Standard Deviation=1.7
Set 4-Standard Deviation=3.2
Which set of data probably has the points closest to the mean?
a)
1
b)
2
c)
3
d)
4
46.
This data is normally distributed.  What percent of the data is in the shaded region?
a)
68%
b)
95%
c)
99.7%
d)
50%
47.

What is the standard deviation for the data given:

5, 10, 7, 12, 0, 20, 15, 22, 8, 2

a)

6.89

b)

10.1

c)

7.26

d)

9

48.
Roger bowled 7 games last weekend. His scores are: 155, 165, 138, 172, 127, 193, 142. What is the range of Roger's scores?
a)
193
b)
127
c)
60
d)
66
49.

What is the standard deviation for the data given:

{12, 13, 29, 18, 61, 35, 21}

a)

293.67

b)

15.87

c)

17.14

d)

41.98

50.

What is the standard deviation for the data given:

{12, 13, 29, 18, 61, 35, 21}

a)

293.67

b)

15.87

c)

17.14

d)

41.98

51.

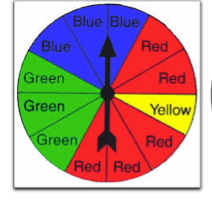
What is the probability of spinning green? (a)  

Choose from the below words
0
1/4
1/2
3/4
52.

Match the following probabilities:

a)

0

1.

Certain

b)

1

2.

Unlikely

c)

12\frac{1}{2}  

3.

As Likely as Not

d)

between 0 and 12\frac{1}{2}  

4.

Likely

e)

between 12\frac{1}{2}  and 1

5.

Impossible

53.

Clara picks a marble at random, puts it back, and then picks another marble at random. (a)  

Choose from the below words
Dependent
Independent
54.

A bag has 3 red marbles, 2 blue and 4 yellow. What is the theoretical probability of pulling a red? (a)  

Choose from the below words
3/10
3/9
1/9
1/3
55.

A bag contains 9 green marbles, 5 yellow marbles and 6 red marbles.  You choose one marble.   What is the probability of selecting a green or red marble?  Do you add or multiply probabilities? (a)  

Choose from the below words
Add
Multiply
56.

A die is rolled. What is the probability of rolling a 5 or a number greater than 3? (a)  

Choose from the below words
2/3
1/2
5/6
1
57.

A bag contains some red-colored and some blue-colored marbles. First a red-colored marble is drawn and then, without replacing the first marble, a blue-colored marble is drawn. Are the two events dependent or independent? (a)  

Choose from the below words
Independent
Dependent
58.

There are 6 red marbles, 5 green marbles, and 4 yellow marbles in a bag. If Joe picks 2 marbles one after the other without replacement, then what is the probability that both are red in color? (a)  

Choose from the below words
2/5
1/21
4/25
1/7
59.
Ricardo has the spinner pictured here and a bag of marbles filled with 2 red marbles, 3 green marbles, and 3 blue marbles. What is the probability that Ricardo spins red on the spinner and picks a red marble out of the bag?
a)
1 ⁄ 16
b)
1 ⁄ 2
c)
1 ⁄ 4
d)
1 ⁄ 8
60.
How many outcomes are there with tossing a coin and rolling a dice?
a)
2
b)
6
c)
12
d)
24
61.

What is the probability of picking a blue marble, putting it back in the bag, then picking a red marble?

a)

37×37\frac{3}{7}\times\frac{3}{7}  

b)

47×47\frac{4}{7}\times\frac{4}{7}  

c)

47×36\frac{4}{7}\times\frac{3}{6}  

d)

47×37\frac{4}{7}\times\frac{3}{7}  

62.

If you spin two times, what is the probability of landing on green both times?

a)

16+16\frac{1}{6}+\frac{1}{6}

b)

16×16\frac{1}{6}\times\frac{1}{6}

c)

16×26\frac{1}{6}\times\frac{2}{6}

d)

13×13\frac{1}{3}\times\frac{1}{3}

63.

If you pick a red marble and keep it, how does that change the probability of getting a green marble when you pick a second time?

a)

No change

b)

More likely

c)

Less likely

d)

Impossible

64.
A coin and a number cube with the numbers 1 through 6 are tossed. What is the probability of the coin showing tails and the number cube showing the number 3? 
a)
1/12
b)
1/4
c)
1/8
d)
1/2
65.
a)
1/4
b)
1/8
c)
1/2
d)
1/6
66.
a)
1/8
b)
1/2
c)
1/24
d)
1/16
67.
An event that consists of two or more events
a)
 event
b)
dependent events
c)
experiment
d)
compound event
68.
How do you find compound probability?
a)
Multiply your probabilities
b)
Add your probabilities
c)
Divide your probabilities
d)
Subtract your probabilities
69.
7P2
a)
0
b)
7
c)
42
d)
210
70.
What does 10Pmean?
a)
Permutations with 5 choices and 10 positions
b)
Permutations with 10 choices and 5 positions
c)
Permutations with 5 numbers and 10 operations
d)
Permutations with 5 hot dogs and 10 drinks
71.
Permutation, combination, or neither?
The batting order for seven players on a 12 person team.
a)
combination
b)
permutation
c)
neither
72.
Which of the following is an example of combination?
a)
Form a passcode with 4 digits
b)
Students line up in a queue to assembly
c)
Choose 4 students in a class committee
d)
Choose the chairperson, secretary and treasurer in a club
73.
12C3
a)
36
b)
66
c)
220
d)
500
74.
If all items chosen are treated the same it is a ....
a)
Comparision
b)
Permutation
c)
Combination
d)
Position
75.
If all items chosen are treated differently it is a ...  
a)
Comparision
b)
Permutation
c)
Combination
d)
Position
76.
What is the value of 5!
a)
25
b)
15
c)
120
d)
720
77.
What does the P stand for in nPr?
a)
Partners
b)
Positions
c)
Papers
d)
Permutations
78.
Determine whether the following scenarios are a permutation or a combination:
 
Selecting a lead and an understudy for a school play.
a)
Combination
b)
Permutation
79.
Determine whether the following scenarios are a permutation or a combination:
 
Selecting a lead and an understudy for a school play.
a)
Combination
b)
Permutation
80.
If Lucas owns 11 hoodies,how many ways can he choose four to bring on vacation?
a)
44
b)
7920
c)
330
d)
121
81.

Permutation or Combination: You are setting the combination on a four-digit lock. You want to use the numbers 3817 but don't care what order they are in.

a)

permutation

b)

combination

82.

9C9=

a)

9!

b)

9

c)

1

83.

Evaluate 9C4Evaluate\ 9_{C_4}  

a)

124

b)

126

c)

125

d)

127