
 Worksheets
Motion Graphs Quiz
Total questions: 26
Worksheet time: 19mins
Calculate the average velocity of an object that travels 100 meters in 20 seconds.
10 meters per second
15 meters per second
25 meters per second
5 meters per second
If the position-time graph of an object is a straight line, what does this indicate about the object's velocity?
Zero
Increasing
Constant
Decreasing
Determine the acceleration of an object from a position-time graph where the slope is 5 m/s^2.
7 m/s^2
2 m/s^2
5 m/s^2
10 m/s^2
Identify the segment on a velocity-time graph that represents constant velocity.
Horizontal line
Diagonal line
Curved line
Vertical line
Calculate the displacement of an object from a velocity-time graph where the area under the curve is 50 meters.
75 meters
25 meters
100 meters
50 meters
What does a negative slope on a position-time graph indicate about the object's motion?
The object is moving in the negative direction.
The object is at rest
The object is accelerating
The object is moving at a constant speed
If the slope of a position-time graph is 0, what does this imply about the object's velocity?
The object's velocity is increasing.
The object's velocity is 0.
The object's velocity is decreasing.
The object's velocity is constant but not necessarily 0.
From a velocity-time graph, how can you determine if an object is accelerating?
Check for a decrease in velocity.
Look for a curve in the velocity-time graph.
Look for a straight line in the velocity-time graph.
Look for a constant velocity.
Explain how the slope of a position-time graph can be used to determine the velocity of an object.
Velocity is calculated by dividing position by time, not by slope
The slope of a position-time graph indicates acceleration, not velocity
The slope of a position-time graph can be used to determine the velocity of an object by calculating the rate of change of position.
The slope of a position-time graph is irrelevant to determining velocity
If the slope of a velocity-time graph is constant, what does this indicate about the object's acceleration?
Zero acceleration
Constant acceleration
Increasing acceleration
Negative acceleration
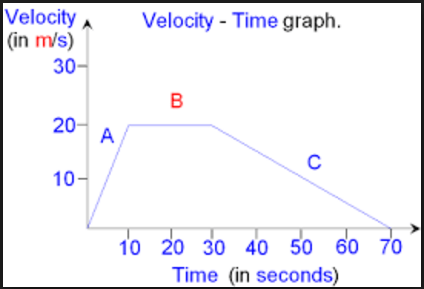
This is a velocity-time graph. What is the object doing in segment A?
Speeding up
Slowing down
Constant Velocity
Not moving

The speed - time graph of a car is given here. Using the data in the graph calculate the total distance covered by the car.
1250 m
875 m
1500 m
870 m
What does the slope of a velocity-time graph represent?
Speed
Time
Acceleration
Distance travelled
Nothing

The graph shows the distance a student walks down a hall over time. During which time interval was the student moving the fastest?
A
B
C
D

On this position vs time graph, what is the velocity?
40 m/s
8 m/s
5 m/s
0 m/s

Which of these Distance Vs. Time graphs shows an object that is at rest?
A
B
C
D

Which of these Distance vs. Time graphs shows an object that is moving at a constant speed away from the reference point?
A
B
C
D

What is the displacement from 15-30 seconds?
150 m
-150 m
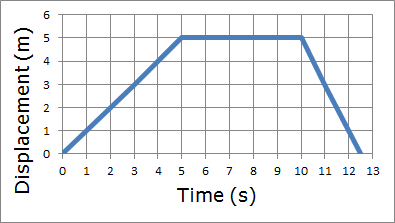
According to the graph how fast does the person travel in the first 5 seconds?
2 m/s
10 m/s
12.5 m/s
1 m/s

This is a velocity-time graph. What is the object doing in segment B?
Positive acceleration
Negative acceleration
Constant Velocity
Not moving
This is a velocity-time graph. What is the object doing in segment A?
Positive acceleration
Negative acceleration
Constant Velocity
Not moving

During which interval is the object speeding up?
A to B
B to C
D to E
E to F

During which interval is the object slowing down?
A to B
D to E
E to F
B to C

For which time period, is there no motion?
0-10 seconds
10-15 seconds
15-40 seconds
40-50 seconds

For which segment, is there a constant velocity of 10 m/s?
A-B
B-C
C-D
D-E

At which point in time, does this person turn around?
3 seconds
5 seconds
10 seconds
25 seconds

