wayground logo

Free Printable Worksheets

Font size

S
M
L
XL
Worksheets

AJH Test 1.1 Review

Total questions: 70

Worksheet time: 4hrs 37mins

Name
Class
Date
1.

The mean is also called the ...

a)

middle

b)

most

c)

average

d)

difference

2.

The number that appears in the set of data the most is called the

a)

mean

b)

mode

c)

median

d)

range

3.

The number in the middle of the set of data is called the

a)

mean

b)

mode

c)

median

d)

range

4.

Find the mean: 10, 11, 8, 14, 12, 8, 4, 5

a)

72

b)

8

c)

9

5.

Find the mode: 10, 11, 8, 14, 12, 8, 4, 5

a)

72

b)

8

c)

9

6.
Lizzy had test scores of:   72, 94, 108, 60
What is the RANGE of her test scores?
a)
12
b)
72
c)
48
d)
98
7.
The mode score on the 6th grade math test was 94! Which of these interpretations must be correct?
a)
99 was the highest score on the test.
b)
More students received a 94 than any other score
c)
No student scored below a 50
d)
A score of 91 was slightly below average.
8.
What is the range?
8, 10, 60, 3, 5, 13, 12, 40, 8
a)
55
b)
8
c)
57
d)
17.7
9.

What is the range?

a)

The sum of the largest and smallest number

b)

The number in the middle

c)

The difference between the largest and smallest number

d)

The number that appears most often

10.

What is the median?

a)

The number in the middle when the numbers are in order from least to greatest.

b)

The difference between the largest and smallest number.

c)

The average

d)

The number that appears most often.

11.

What is the MEDIAN of this set of data?

10, 90, 80, 60, 50, 40, 70, 30, 20, 100

a)

50

b)

60

c)

55

d)

45

12.
What’s the mode?
a)
1
b)
2
c)
7
d)
9
13.
Find the median of these numbers:
4,2,7,4,3
a)
2
b)
5
c)
7
d)
4
14.
A data set can have more than one mode
a)
True
b)
False
15.
To find the average of a set of numbers, add up all the items and divide by...
a)
2
b)
The minimum
c)
The maximum
d)
The number of items
16.
Roger bowled 7 games last weekend. His scores are: 155, 165, 138, 172, 127, 193, 142. What is the range of Roger's scores?
a)
193
b)
127
c)
60
d)
66
17.

Look at these numbers - 11, 11, 7, 18, 8. What is the correct way to put them in order so you can find the median?

a)

18, 11, 11, 8, 7

b)

11, 7, 8, 18, 11

c)

8, 7, 11, 11, 18

d)

7, 8, 11, 11, 18

18.

What is the Maximum data item on this stem and leaf plot?

a)

56%

b)

88%

c)

94%

d)

8122348%

19.

What is the Mode of this data?

a)

96

b)

97

c)

68

d)

802

20.

What is the Minimum data item?

a)

0

b)

71

c)

5

d)

23

21.

How many data items are on the plot?

a)

16

b)

21

c)

22

d)

100

22.
In how many games did the team score more than 20 points?
a)
8
b)
7
c)
10
d)
9
23.
A way to describe the shape of a data display that indicates most of the data is on one side of the display.
a)
symmetric
b)
unimodal
c)
skewed
d)
uniform
24.
What is the minimum in this data set?
a)
0
b)
4
c)
9
d)
40
25.
What is an interval?
a)
A single number
b)
A range of numbers
c)
A percentage
d)
A total amount
26.
21. How many students are represented by the histogram?  
a)
Cannot be determined
b)
9
c)
31
d)
35
27.
How many students are between 48 and 51 inches tall?
a)
14
b)
8
c)
2
d)
0
28.
How many people watched more than 25 hours of TV last week?
a)
0
b)
10
c)
38
d)
42
29.

What is the mode height interval?

a)

56-59

b)

52-55

c)

60-67

d)

64-67

30.
How many students got a perfect score on the test?
a)
0
b)
2
c)
6
d)
1
31.

What is the range of the distances the baseball was thrown?

a)

10.05 feet

b)

8.5 feet

c)

8.2 feet

d)

8.0 feet

32.
What type of graph is this?
a)
Line Graph
b)
Pictograph
c)
Bar Graph
d)
Histogram
33.

At a candy factory, butterscotch candies were packaged into bags of different sizes.


How many bags had exactly 66 butterscotch candies?

a)

3

b)

1

c)

4

d)

2

34.
What is the MEDIAN of this data
a)
95
b)
90
c)
100
d)
40
35.
What is the MODE of this data?
a)
100
b)
20
c)
80, 85, and 90
d)
none
36.
How many students spent 7 hours doing homework that week?
a)
1
b)
3
c)
5
d)
6
37.
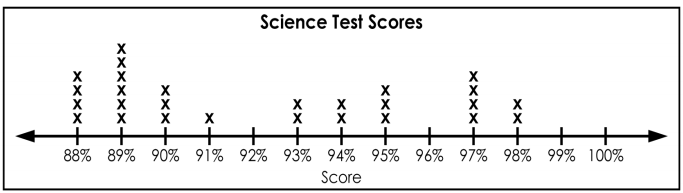
How many total students are in the science class?
a)
13
b)
6
c)
27
d)
25
38.
What is the highest score in the class?
a)
88%
b)
100%
c)
13
d)
98%
39.
How many people have two or less books in their desk?
a)
4
b)
5
c)
6
d)
7
40.

Which statement best describes the data shown in the dot plot?

a)

The peak of the data is at 35

b)

The data are clustered from 30 to 32

c)

The data distribution has gaps

d)

The data distribution is symmetrical

41.

How many cars were sold on Thursday and Friday

a)

6

b)

7

c)

8

d)

9

42.
How many students had more than 6 candy bars?
a)
5
b)
2
c)
3
d)
1
43.
How many students scored 93% or less?
a)
6
b)
16
c)
14
d)
13
44.

How many students have a shoe size bigger than 8?

a)

2

b)

3

c)

4

d)

9

45.
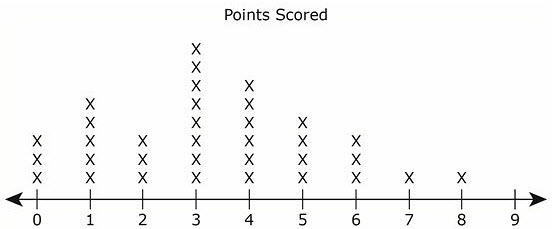
The dot plot below shows the points scored by players in a basketball game.

What is the difference between the number of players who scored fewer than 4 points and the number of players who scored more than 4 points?
a)
4 players
b)
10 players
c)
13 players
d)
15 players
46.

Describe the shape of Daniel's data

a)

skewed left

b)

skewed right

c)

symmetrical

47.

Which of the following two statements are true?

a)

More people did over 33 push ups than who did less than 32 push ups.

b)

There were 14 people questioned.

c)

More people did more than 33 push ups than did less than 33 push ups.

d)

6 people did 35 push ups

48.
A florist records the amount of money he spent on gasoline each week to deliver orders. The list shows the data for 16 weeks.
 32, 38, 40, 44, 44, 46, 49, 53, 55, 58, 62, 65, 68, 70, 72, 81
 He put the data in a stem-and-leaf plot. What number did he leave out of the stem-and-leaf plot?
   

a)
32
b)
44
c)
65
d)
81
49.
How many people watched less than 11 hours of TV last week?
a)
48
b)
90
c)
20
d)
65
50.

This is a histogram

a)

true

b)

false

51.
Which interval has the highest frequency?
a)
9 - 10 books
b)
7-8 Books
c)
5-6 Books
d)
3-4 Books
52.
A data value that is much higher or much lower than the other values in a data set.
a)
outlier
b)
inlier
c)
immalier
d)
sublier
53.
Which numbers have a gap?
a)
8-10
b)
9-12
c)
15-18
d)
18-19
54.

Look at the double Bar Graph. What ice cream flavour do children dislike the most?

a)

Mango

b)

Vanilla

c)

Chocolate

d)

Almond

55.

How many more girls chose track as the favourite sport than boys?

a)

3

b)

999

c)

9

d)

1

56.
How many students scored 93% or less?
a)
6
b)
16
c)
14
d)
13
57.
How many more students scored a 98 than scored a 88?
a)
4
b)
2
c)
6
d)
35
58.
How many students spent 7 hours doing homework that week?
a)
1
b)
3
c)
5
d)
6
59.
Each dot represents 1 day. How many days were recorded?
a)
9
b)
21
c)
20
d)
105
60.
What is the difference between the highest score and the lowest score on the test?
a)
15
b)
100
c)
6
d)
10
61.

What is the mean of the numbers 3.5, 4.2, 2.8, and 5.1?

a)

2.3

b)

6.0

c)

3.9

d)

4.5

62.

What is the mean of the numbers 3.5, 4.2, 2.8, and 5.1?

a)

2.3

b)

6.0

c)

3.9

d)

4.5

63.

Find the mean of 2.3, 4.5, 3.2, and 5.6.

a)

2.5

b)

4.0

c)

6.8

d)

3.9

64.

Calculate the average of 2.4, 3.6, 4.8, and 5.2.

a)

3.5

b)

4.0

c)

4.5

d)

5.0

65.
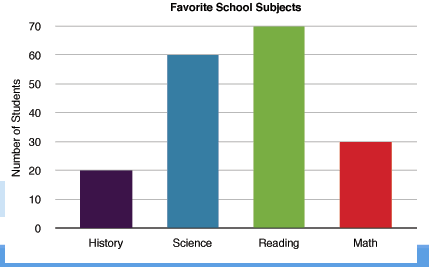
How many total people took the survey?
a)
50
b)
150
c)
100
d)
200
66.
Which subject has 10 fewer votes than Reading?
a)
History
b)
Science
c)
Math
d)
Spelling
67.

Based on the graph, how many more students are in the science club than the book club?

a)

20

b)

16

c)

46

d)

18

68.

The graph shows how employees at Disney World travel to work. How many employees ride bikes, ride the bus, or walk to work?

a)

300

b)

450

c)

325

d)

375

69.

According to this graph, how many people own a dog?

a)

8

b)

11

c)

6

d)

3

70.

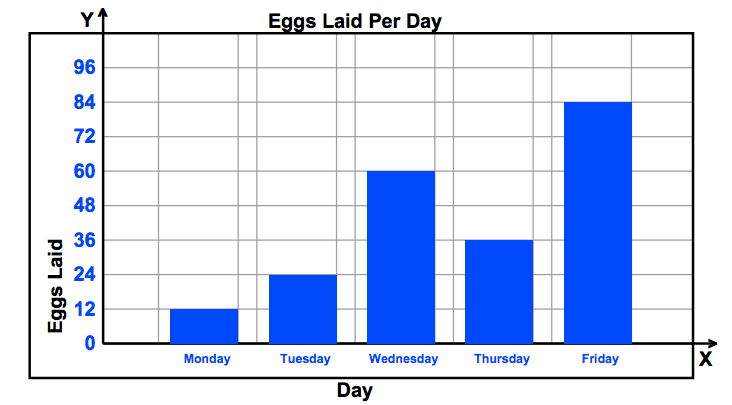
How many more eggs were laid on Friday than Wednesday?

a)

84

b)

36

c)

24

d)

60