
NEW
Font size
 Worksheets
Mastering Graphic Literacy Skills
Total questions: 18
Worksheet time: 9mins
What type of chart is best suited for showing parts of a whole?
Line Chart
Histogram
Pie Chart
Scatter Plot
In a pie chart, what does each slice represent?
A different variable
A different category of the same variable
The total value of all categories
The average value of all categories
Which type of chart is best for showing trends over time?
Pie Chart
Line Graph
Bar Chart
Scatter Plot
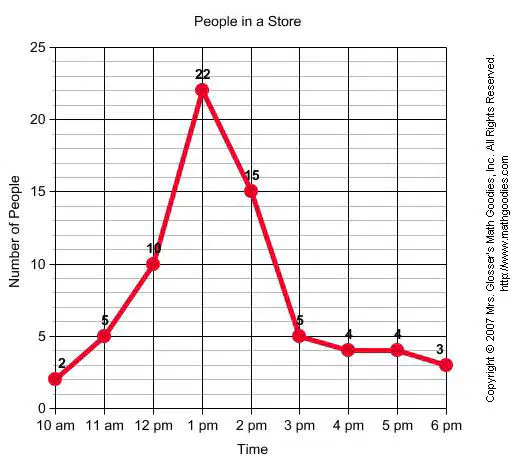
What time of the day had the most number of people in the store?
3:00PM
10:00AM
1:00PM
Not enough information.
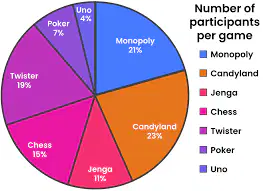
What is the percentage of participants per game for Monopoly?
15%
21%
7%
4%
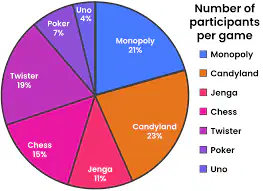
What is the total percentage of participants per game in Candyland, Twister, Chess and UNO?
70%
23%
15%
61%
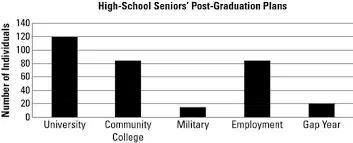
What post-graduation plan did most seniors choose?
Military
University
Gap Year
Community College
What are types of graphs we have discussed in class?
photo graphs, line graphs, and pie charts
Bar graphs, line graphs, and pie charts
population pyramids, flow charts, and line graphs
Bar graphs, scatter plot, and line graphs
The _________________________ tells you what the graph is about.
Bars
Y-axis
Title
X-axis
TRUE or FALSE: The Y-axis is vertical.
TRUE
FALSE
TRUE or FALSE: The X-axis is vertical.
TRUE
FALSE
On a pie chart, the _________________________ tells you what each slice represents.
Title
slices
bars
labels
A table is made up of __________________________.
bars and lines
units and values
rows and columns
none of the above
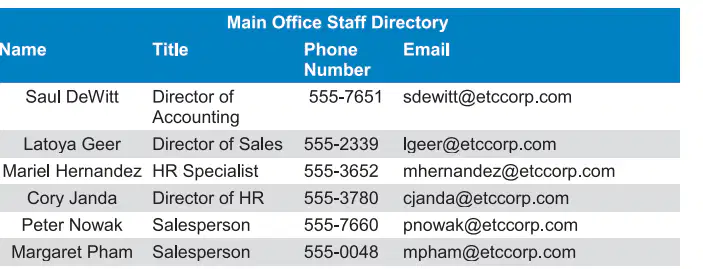
According to Main Office Staff Directory, who is the HR Specialist?
Latoya Geer
Saul DeWitt
Margaret Pham
Mariel Hernandez
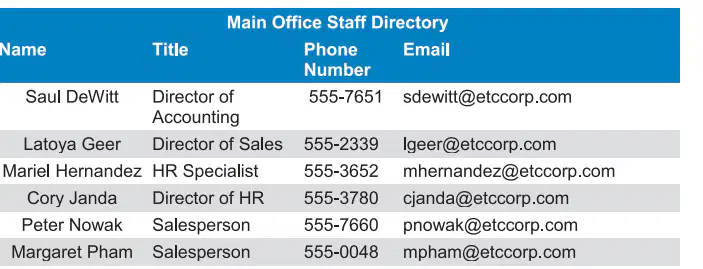
Peter Nowak's title is _____________________.
Director of Accounting
Director of Sales
Sales Manager
Salesperson

The chart shows customers ratings of a line of vacuum cleaners sold at your company. Where can you find column headings?
In the top row
In the left column
At the bottom of the chart
There's not enough information.

Which cleaner received the highest product rating?
Dust Viper 360
Power Vacuum 25
Power Vacuum 120
Cyclone DW3
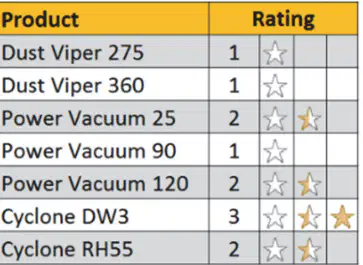
In the chart, you can find all of the following information except:
a number and symbol rating.
a comparison of different products.
the price of each vacuum.
product name.

