
 Worksheets
Graphs of Motion: Match and Analyze
Total questions: 25
Worksheet time: 15mins
A position-time graph shows a straight line with a positive slope. Which of the following velocity-time graphs corresponds to this scenario?
A horizontal line above the time axis
A line with a positive slope
A line with a negative slope
A horizontal line on the time axis
If a position-time graph is a horizontal line, what does the corresponding velocity-time graph look like?
A horizontal line above the time axis
A horizontal line on the time axis
A line with a positive slope
A line with a negative slope
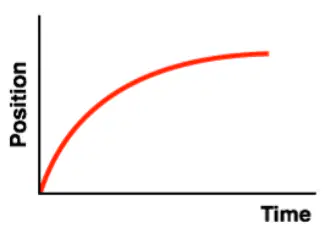
A position-time graph shows a curve that is concave up. What does this indicate about the object's motion?
The object is moving with constant velocity
The object is accelerating
The object is decelerating
The object is changing direction
Which of the following position-time graphs indicates that the object is decelerating?
A straight line with a positive slope
A curve that is concave down
A horizontal line
A curve that is concave up
A velocity-time graph shows a line with a negative slope. What does this indicate about the object's motion?
The object is moving with constant velocity
The object is accelerating
The object is decelerating
The object is at rest
If a velocity-time graph is a horizontal line below the time axis, what does this indicate about the object's motion?
The object is moving with constant positive velocity
The object is moving with constant negative velocity
The object is accelerating
The object is decelerating
A position-time graph shows a curve that initially slopes upwards, then downwards. What does this indicate about the object's motion?
The object is moving with constant velocity
The object is accelerating
The object is decelerating
The object is changing direction
Which of the following velocity-time graphs indicates that the object is moving with constant velocity?
A horizontal line above the time axis
A line with a positive slope
A line with a negative slope
A curve that is concave up
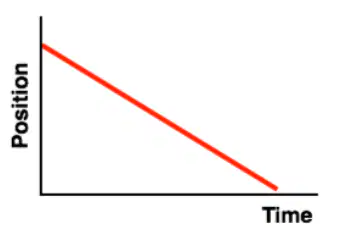
A position-time graph shows a line with a negative slope. What does this indicate about the object's motion?
The object is moving with constant positive velocity
The object is moving with constant negative velocity
The object is accelerating
The object is decelerating
If a velocity-time graph shows a curve that is concave down, what does this indicate about the object's motion?
The object is accelerating
The object is decelerating
The object is moving with constant velocity
The object is changing direction
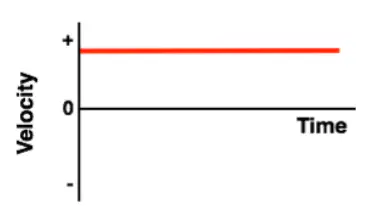
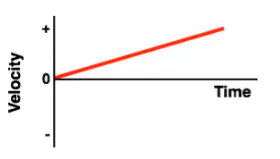
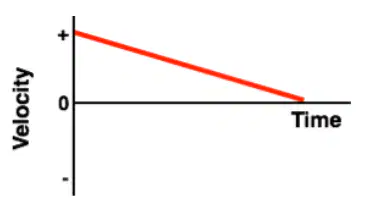
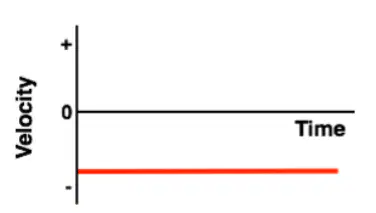
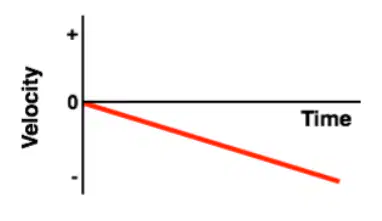
Match the following velocity time graphs with their corresponding descriptions
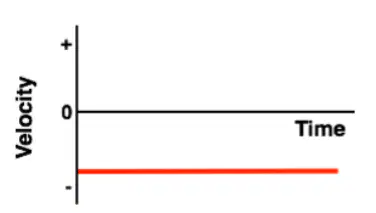
Constant velocity in negative direction
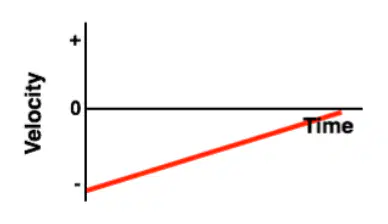
Positive acceleration
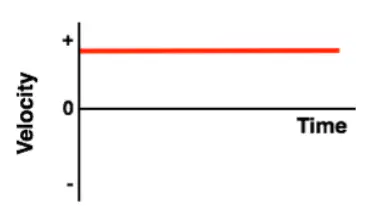
Constant velocity in
+ve direction
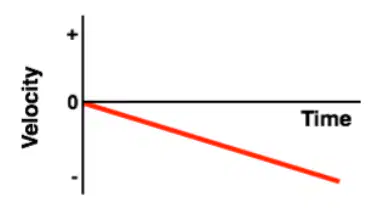
Speeding up in the negative direction
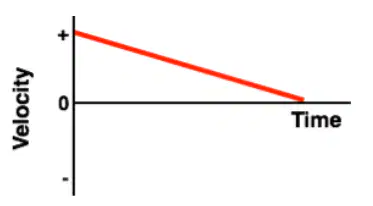
Slowing down in positive direction
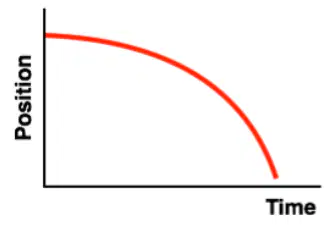
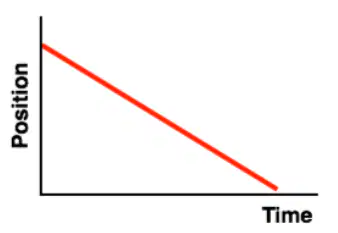
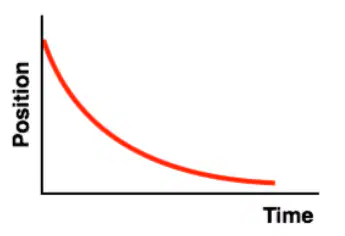
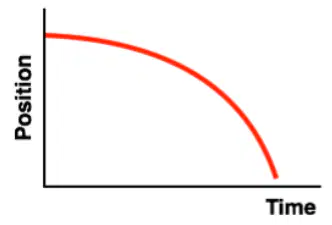
Match this x-t graph to its corresponding v-t graph
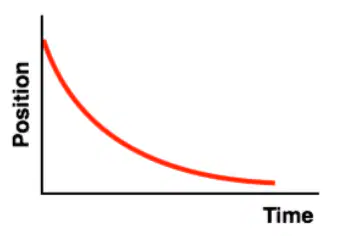
Match this x-t graph to its corresponding v-t graph
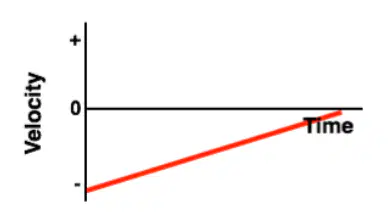

Match this x-t graph to its corresponding v-t graph
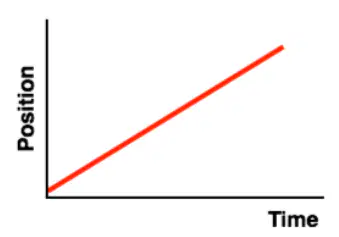
Match this x-t graph to its corresponding v-t graph
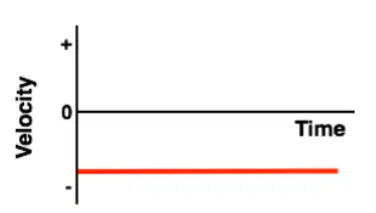
Match this v-t graph to its corresponding x-t graph
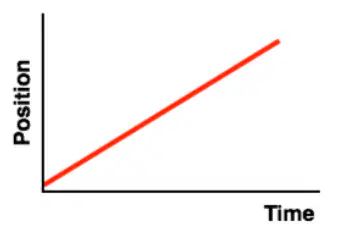

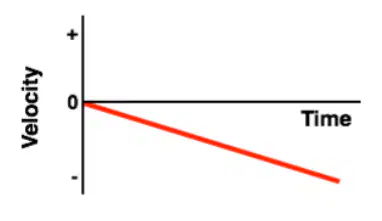
Match this v-t graph to its corresponding x-t graph
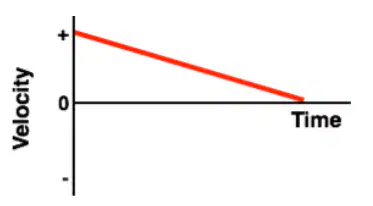
Match this v-t graph to its corresponding x-t graph
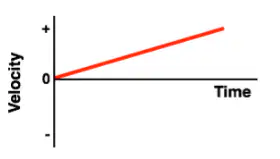
Match the v-t graph to its corresponding x-t graph
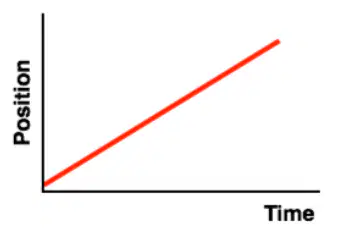
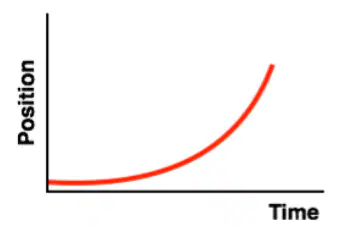

The acceleration from 3-5s is (a) m/s2.

In the velocity-time graph shown, at which time was the object traveling the fastest?
10 s
20 s
30 s
40 s
For the velocity-time graph shown, which best describe the motion for 10-15 s?
not moving, not accelerating
moving forward, not accelerating
moving backward, not accelerating
moving forward, accelerating forward
For the velocity-time graph shown, which interval had the greatest acceleration?
0-10s
10-15s
15-40s
40-55s
The gradient of a velocity-time graph represents (a) .
A curve on a velocity-time graph shows that the acceleration is (a) .

