
 Worksheets
Exam Modul 2 Preparation
Total questions: 26
Worksheet time: 1hrs 24mins

Gunakan CTE untuk menghitung total belanja tiap pelanggan pada tahun 2023 dan hanya tampilkan pelanggan yang total belanjanya lebih dari 500. Pilih query mana yang benar:
a) WITH CustomerTotal AS (
SELECT customer_id, SUM(total_amount) AS total_spent
FROM Orders
WHERE order_date >= '2023-01-01' AND order_date <= '2023-12-31'
GROUP BY customer_id
)
SELECT customer_id, total_spent
FROM CustomerTotal
WHERE total_spent > 500;
b) WITH CustomerTotal AS (
SELECT customer_id, SUM(total_amount) AS total_spent
FROM Orders
WHERE order_date >= '2023-01-01' AND order_date <= '2023-12-31'
)
SELECT customer_id, total_spent
FROM CustomerTotal
WHERE total_spent > 500;
c) WITH CustomerTotal AS (
SELECT customer_id, total_amount AS total_spent
FROM Orders
WHERE order_date >= '2023-01-01' AND order_date <= '2023-12-31'
GROUP BY customer_id
)
SELECT customer_id, total_spent
FROM CustomerTotal
WHERE total_spent > 500;
d) WITH CustomerTotal AS (
SELECT customer_id, COUNT(total_amount) AS total_spent
FROM Orders
WHERE order_date >= '2023-01-01' AND order_date <= '2023-12-31'
GROUP BY customer_id
)
SELECT customer_id, total_spent
FROM CustomerTotal
WHERE total_spent > 500;

Query manakah yang akan mengembalikan daftar semua pelanggan dan jumlah total produk yang mereka pesan, termasuk pelanggan yang tidak memiliki pesanan?
SELECT Customers.CustomerName, SUM(Orders.Quantity) AS TotalQuantity
FROM Customers
INNER JOIN Orders ON Customers.CustomerID = Orders.CustomerID
GROUP BY Customers.CustomerName;
SELECT Customers.CustomerName, SUM(Orders.Quantity) AS TotalQuantity
FROM Customers
LEFT JOIN Orders ON Customers.CustomerID = Orders.CustomerID
GROUP BY Customers.CustomerName;
SELECT Customers.CustomerName, COUNT(Orders.OrderID) AS TotalOrders
FROM Customers
RIGHT JOIN Orders ON Customers.CustomerID = Orders.CustomerID
GROUP BY Customers.CustomerName;
SELECT Customers.CustomerName, SUM(Orders.Quantity) AS TotalQuantity
FROM Customers
FULL OUTER JOIN Orders ON Customers.CustomerID = Orders.CustomerID
GROUP BY Customers.CustomerName;

Manakah dari pernyataan berikut yang benar mengenai cara menghitung total pendapatan dari setiap produk?
a) df.groupby('Produk')['Harga'].sum()
b) df.groupby('Produk')['Harga'].sum() * df['Jumlah']
c) df.groupby('Produk').apply(lambda x: (x['Harga'] * x['Jumlah']).sum())
d) df['Harga'] * df['Jumlah']

Apa hasil dari kode berikut?
A. [12 15 18]
B. [ 6 15 24]
C. [15 18 21]
D. [ 1 2 3]
Apa fungsi dari metode dropna() dalam pandas?
A. Menghapus kolom yang tidak memiliki data.
B. Menghapus baris yang memiliki nilai NaN.
C. Mengganti nilai NaN dengan nilai tertentu.
D. Mengembalikan DataFrame tanpa mengubahnya.
np.random.randint(0, 50, 6).reshape(3, 2) ,mana output yang benar?
a. array([[0.11272585, 0.50231826], [0.95693598, 0.83532571], [0.24816881, 0.92556657]])
b. array([[0.11272585, 0.50231826, 0.95693598], [0.83532571, 0.24816881, 0.92556657]])
c. array([[29, 22], [12, 35], [23, 21]])
d. array([[29, 22, 12], [35, 23, 21]])
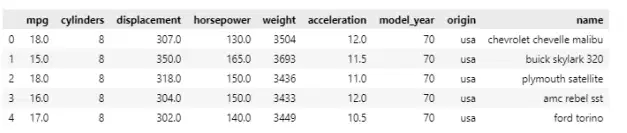
Untuk menampilkan nama mobil yang memiliki horsepower paling besar, manakah kode yang benar?
a. df[df['horsepower'] == df['horsepower'].max()].loc['name']
b. df['name'][df['horsepower'] == df['horsepower'].max()]
c. df.iloc[df['horsepower'] == df['horsepower'].max()]['name']
d. df.loc[df['horsepower'].max()]['name']
Manakah pernyataan yang benar mengenai populasi dan sampel?
a. Parameter adalah ringkasan numerik dari populasi
b. Populasi adalah bagian dari sampel
c. Pengambilan sampel tidak boleh acak
d. Pemaanfaatan sampel untuk menarik kesimpulan terhadap populasi dinamakan Statistika
Deskriptif
Batas atas dari boxplot adalah ....
a. Q1 + (1.5*IQR)
b. Q1 - (1.5*IQR)
c. Q3 + (1.5*IQR)
d. Q2 + (1.5*IQR)
Dikeahui sebuag dataset berisikan data penjualan rumah secara online di Indonesia memiliki sebuah
kolom/variabel bernama ‘Harga_Rumah’ yang berisi nilai harga dari tiap rumah yang dijual dan distribusi
datanya tidak normal. Sebaiknya measure of central tendency yang digunakan adalah
a. Mean
b. Median
c. Modus
d. Standar deviasi
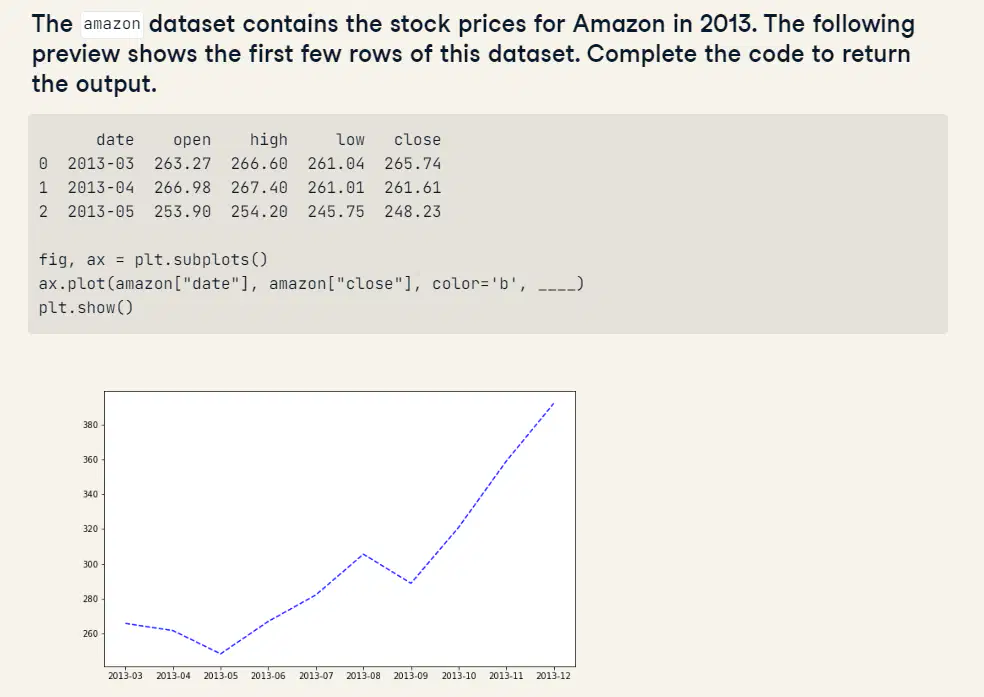
isi dengan code yang tepat
marker='--'
linestyle='--'
marker='None'
linestyle='None'

# Fixing a Plotly figure
# Update the type
monthly_sales['data'][0][__1__] = __2__
# Update the title text
monthly_sales[__3__][__4__]['text'] = 'Sales for Jan-Mar 2020'
# Create a figure
fig = go.__5__
# Print it out!
fig.show()
'type'
'bar'
'layout'
'title'
Figure(monthly_sales)


# Create a simple histogram
fig = px.histogram(
data_frame=__1__,
# Set up the x-axis
__2__=__3__,
# Set the number of bins
__4__=__5__)
# Show the plot
fig.show()
revenues
x
'Revenue'
nbins
6
Statistics can be used to answer lots of different types of questions, but being able to identify which type of statistics is needed is essential to drawing accurate conclusions. Identify which questions can be answered with inferential statistics
given data on all 100000 people who viewed an ad, what percent of people clicked on it?
after interviewing 100 customers, what percent of all yout customers are satisfied with your product?
given data on every customer service request made, what's the average time it took to respond?
given data on 20 fish caught in a lake, what's the average weight of all fish in the lake?
Organize these options into the right categories
kilowatts of electricity used
air temeprature
number of items in stock
number of Purwadhika courses taken
Brand of a product
Zip code
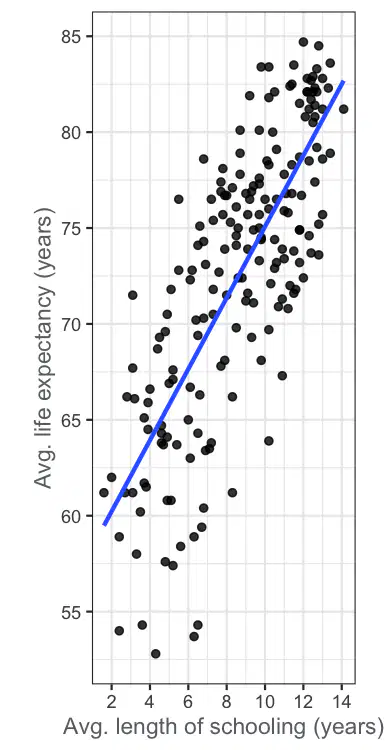
Scatter plots let you explore the relationship between two continuous variables.
Here you can see a scatter plot of average life expectancy (on the y-axis) versus average length of schooling (on the x-axis) for countries around the world. Each point in the plot represents one country. A straight trend line from a linear regression model is shown.
there is + correlation between life expect & length of schooling
as the average length of schooling increases, average life expectancy typically increases too
there is a negative corr between the life expectancy & length of schooling
no country have an average length of schooling < 6 yrs & an average life expectancy of > 75 yrs
What is the difference between mean and median?
Mean is the middle value; median is the average.
Mean is the average; median is the middle value.
Both represent the average.
Mean and median are used interchangeably.
What does the term "confidence interval" represent in statistical analysis?
The range of values within which a population parameter is estimated to lie
The average of sample values
The proportion of data falling within a specified range
The standard error of the mean
What is the purpose of correlation in data analysis?
Causation between variables
Describing the spread of data
Measuring the strength and direction of a linear relationship
Identifying outliers
What does a histogram visualize?
Relationships between two variables
Distribution of a single variable
Hierarchical data structures
Time-series data
What does the term "outlier" mean in data analysis?
The most common value in a dataset
Unusual or extreme values in a dataset
The difference between mean and median
The last value in a sorted dataset
What is the primary goal of data analysis?
Making predictions
Summarizing and interpreting data
Designing databases
Data visualization
What is the significance of the term "standard deviation"?
Measuring central tendency
Describing the spread or dispersion of data
Identifying the most frequent value
Representing the range of values
kamu diminta untuk menuliskan regex di Python untuk mencocokkan email yang valid dengan format sebagai berikut:
Hanya boleh ada satu karakter "@".
Domain harus terdiri dari huruf dan angka.
Domain berakhiran dengan ".com" atau ".id".
Email harus dimulai dengan huruf atau angka, dan dapat mengandung karakter ".", "_", atau "-" setelahnya.
Manakah dari opsi regex berikut yang benar untuk mencocokkan email valid tersebut?
a) r'^[a-zA-Z0-9]+[._-]?[a-zA-Z0-9]+@[a-zA-Z0-9]+\.(com|id)$'
b) r'^[a-zA-Z0-9._-]+@[a-zA-Z]+\.(com|id)$'
c) r'^[a-zA-Z0-9]+@[a-z]+\.(com|org|id)$'
d) r'^[a-z0-9_]+@[a-z0-9]+\.(com|id)$'
Di bawah ini adalah hasil uji normalitas dari variabel 'weight':
from scipy.stats import normaltest
normaltest(df['weight'])
NormaltestResult(statistic=46.08618081354447, pvalue=9.829082726891064e-11)
Pilihlah peryataan yang tepat mengenai uji di atas!
a. Hasil uji normalitas di atas menunjukkan variabel ‘weight’ terdistribusi normal
b. Hasil uji normalitas di atas menunjukkan variabel ‘weight’ terdistribusi tidak normal
c. Method normaltest dari scipy di atas menggunakan metode Shapiro-Wilk
d. Method normaltest dari scipy di atas menggunakan metode Kolmogorov-Smirnov

