
 Worksheets
Motion Graphs
Total questions: 50
Worksheet time: 2hrs 6mins
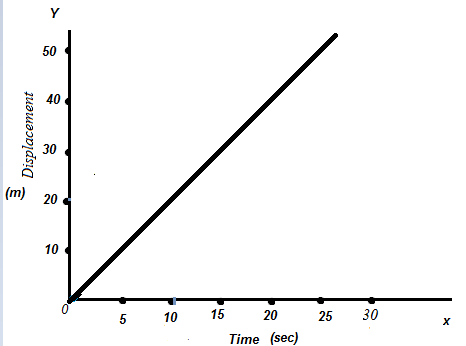
What is shown in this displacement vs time graph?
uniform (constant) velocity
increasing velocity
no speed (at rest)
acceleration
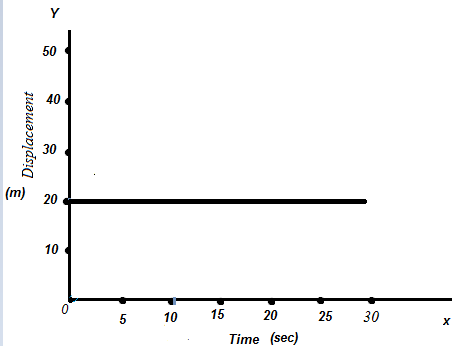
What does this motion graph mean?
no velocity (at rest)
uniform velocity
uniform speed
Increasing velocity
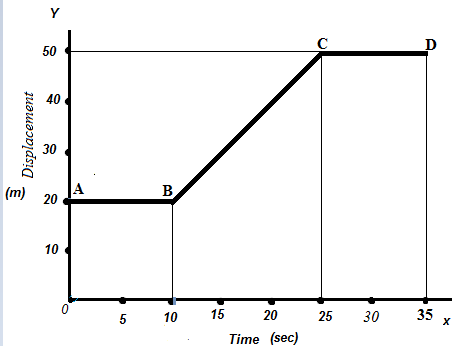
What is happening between B and C in this displacement-time graph?
constant acceleration
uniform velocity
at rest
increasing velocity
What is happening between points C and D in this displacement-time graph?
constant acceleration
uniform velocity
at rest
slowing down
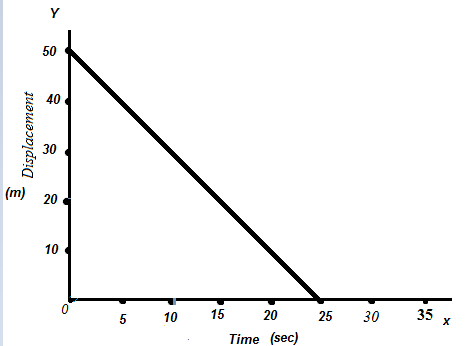
What is happening in this displacement-time graph?
constant positive velocity
constant negative velocity
negative acceleration
speeding up
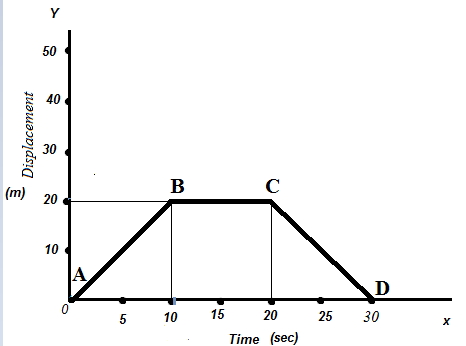
What is happening from A to B, from B to C, and from C to D in the displacement-time graph?
A to B uniform positive velocity, B to C at rest, C to D uniform negative velocity
A to B positive acceleration, B to C no acceleration and C to D negative acceleration
A to B high speed, B to C low speed, C to D very low speed
A to B uniform acceleration, B to C constant speed, and C to D is slowing down
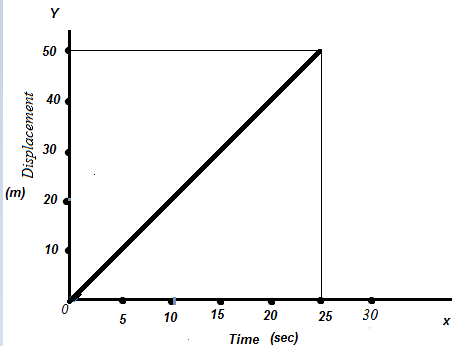
Find the velocity from the given graph.
2 m/s
21 m/s
100 m/s
-2m/s
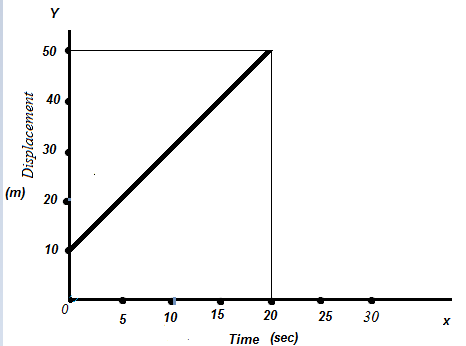
Find the velocity from the given graph.
2 m/s
-2m/s
2.5m/s

Find the velocity from the given graph.
-2m/s
−21 sm
2m/s
Initial velocity of a car was 10m/s after 5s the velocity of the car 30m/s. Find the acceleration of the car.
4
s2m4m/s
3m

Describe the motion in the graph:
Constant Speed (positive slope)
Stopped (at rest)
Acceleration (increasing speed)
Return Home (negative slope)

Describe the motion in the graph:
Constant Speed (positive slope)
Stopped (at rest)
Acceleration (increasing speed)
Return Home (negative slope)

In which graph is the runner running the fastest?
graph A
graph B
graph C
graph D

Which sentence best describes the runner whose distance-time graph is shown?
The runner ran forward for 2 seconds, and then ran backward for 2 more seconds.
The runner ran forward for 2 seconds, and then stood still for 2 more seconds.
The runner ran forward for 2 seconds, and then ran forward more slowly for 2 more seconds.
The runner ran forward for 2 seconds, and then turned right and continued forward at the same speed for 2 more seconds.
Match the description to the graph:
"The car is coming back."


Segment A-B The bus is _________________.
at rest
returning (to original position)
moving forward
constant speed
Segment B-C The bus is _________________.
at rest
returning (to original position)
moving forward
speeding up
Segment E-F The bus is _________________.
at rest
returning (to original position)
moving forward
moving slowly
In which of the following displacement-time graphs below did one runner overtake (run past) the other?


During which stage is the object moving away from its starting point?
A
B
C
D
E
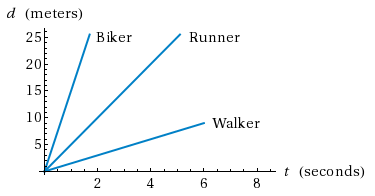
Which person moved the fastest in 3 seconds?
biker
runner
walker
they are all moving equally

The graph shows the distance a student walks down a hall over time. During which time interval was the student moving the fastest?
A
B
C
D

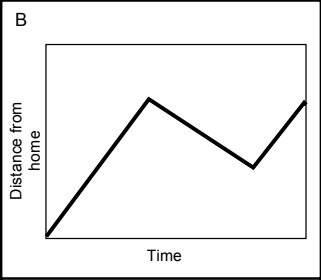
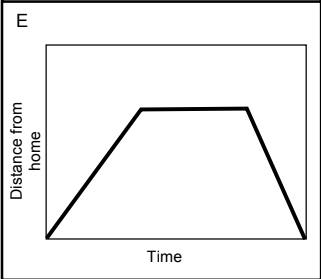
Which is the BEST statement that matches the displacement-time graph shown?


Susie went to the store, when she got there she realized that she forgot her wallet and returned home.
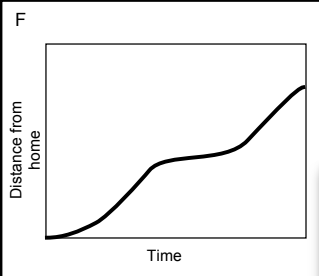
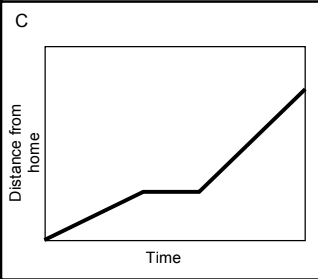
Which graph matches this motion?
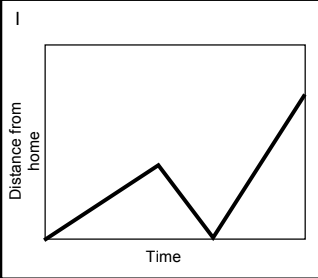
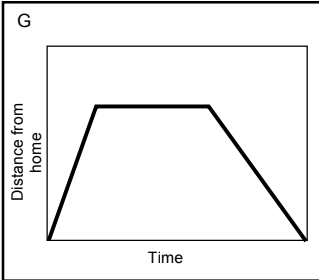
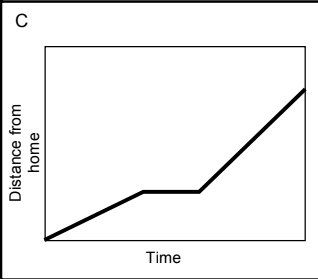
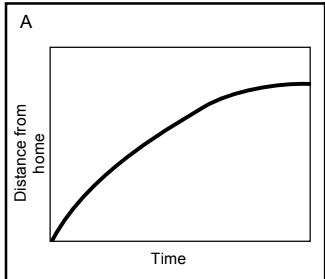
Deb walked to the ice cream shop. Sat and ate her ice cream and then went for a run.
Which graph matches this motion?

Use the velocity-time graph above and pick the most accurate description of the object's motion
object is moving at constant speed
object is speeding up
object is at rest
object is slowing down

Use the picture above to choose the most accurate description of the object's motion
object is at rest
object is slowing down
object is moving at a constant speed
object is speeding up

At what time does the object switch directions?
15 minutes
40 minutes
10 minutes
30 minutes
To determine how fast an object is moving on a Velocity-time graph I should...
Look at the vertical axis for that time
Determine the area between the graph & the x axis up to that time
See whether the graph is above or below the x axis at that time
Solve for the slope of the graph at that time
To determine which way an object is moving on a Velocity-time graph I should...
Look at the vertical axis for that time
Determine the area between the graph & the x axis up to that time
See whether the graph is above or below the x axis at that time
Solve for the slope of the graph at that time
To determine an object's acceleration using a Velocity-time graph I should...
Look at the vertical axis for that time
Determine the area between the graph & the x axis up to that time
See whether the graph is above or below the x axis at that time
Solve for the slope of the graph at that time


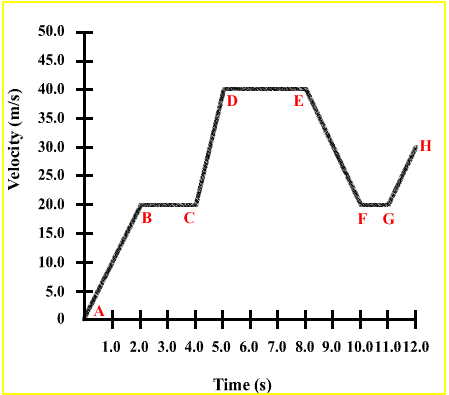

What segment of the graph shows no motion, or standing still?
A - B
B - C
C - D
None

Select the description of motion from A - B.
Slowing down away from the origin
Speeding up away from the origin
Constant velocity away from the origin
Constant velocity towards the origin

Describe motion of C - D.
Constant velocity away from the origin
Slowing down away from the origin
Slowing down away from the origin and then slowing down towards the origin
Slowing down away from the origin and then speeding up towards from the origin

Describe the motion from B - C.
Standing still
Constant velocity of 60 m/min
Constant velocity of 0 m/min
Accelerating
What does a horizontal line (not on the x-axis) mean on a V-T graph?
No movement
Constant velocity
Changing velocity
Change in direction


Between which two points is the car parked?
AB
DE
FG
BC

What is occuring between points B and C?
The car is moving at a constant velocity of 2 km/min.
The car is parked.
The car is accelerating at a rate of 2 km/min/min.
The car is moving at a constant speed of 3.5 km/min.

What was occurring from point B to point C?

