
 Worksheets
Precalculus Fall 2024 Final
Total questions: 100
Worksheet time: 8hrs 54mins

The given graph models Mr. Passwater’s distance from his home over time. Time, in hours, is the independent variable and the distance from home, in miles, is the dependent variable. Which of the following verbal descriptions would be appropriate for the given graph? (1.)
Mr. Passwater leaves school and drives toward his house at a constant rate. Then, he stops to eat at a restaurant for a period of time to eat dinner. After eating dinner, Mr. Passwater leaves and drives until he reaches his house, driving at a constant rate that is faster than the rate he was driving when he first left school.
Mr. Passwater leaves school and drives toward his house, increasing his speed as he drives. Then, he drives at a constant rate for a period of time. Finally, he increases his speed again and drives until he reaches his home.
Mr. Passwater leaves his house and drives at a constant rate to a nearby restaurant. After stopping for a period of time to eat lunch, Mr. Passwater drives back to his home at a constant rate that is faster than his rate when driving to the restaurant.
Mr. Passwater leaves his house and drives to a restaurant at a constant rate. Then, he stops to eat at a restaurant for a period of time to eat breakfast. After eating breakfast, Mr. Passwater leaves and drives until he reaches his school, driving at a constant rate that is faster than the rate he was driving when he first left his house.

The figure shows the graph of a function f for 0 ≤ x ≤ 5. Which of the following statements is true about the function f? (16.)
f is increasing at an increasing rate.
f is increasing at a decreasing rate.
f is decreasing at an increasing rate.
f is decreasing at a decreasing rate.
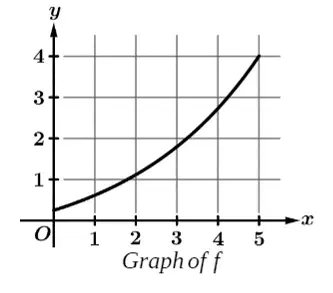
The figure shows the graph of a function f for 0 ≤ x ≤ 5. Which of the following statements is true about the rate of change of f? (24.)
The rate of change of f is positive and increasing.
The rate of change of f is positive and decreasing.
The rate of change of f is negative and increasing.
The rate of change of f is negative and decreasing.

Which of the following statements is true about the function f for 0 ≤ x ≤ 5? (32.)
The function f is increasing and the graph of f is concave up.
The function f is increasing and the graph of f is concave down.
The function f is decreasing and the graph of f is concave up.
The function f is decreasing and the graph of f is concave down.
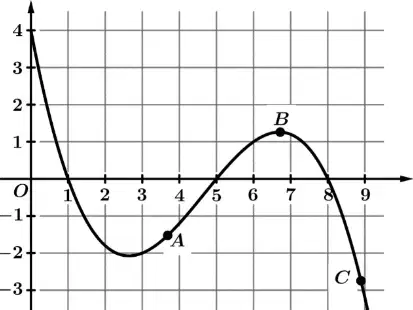
Consider the rates of change of k at the three labeled points. Which of the following orders the rates of change of k in order from least to greatest? (50.)
A, B, C
B, A, C
C, A, B
C, B, A

The table gives values for a continuous function f at selected values of x. What is the average rate of change of f over the closed interval [0, 3]? (54.)
1/2
1
2
3

Let g be the piecewise function defined as in the figure. What is the average rate of change of g over the closed interval [-2, 4]? (56.)
-2
1
2
7/3

Use the graph of f below to answer the question. What is the average rate of change of f over the closed interval [3, 5]? (59.)
(A) 1/2
(B) 1
(C) 2/3
(D) 2

The table shows values for a function g at selected values of x. Which of the following claim and explanation statements best fit these data? (67.)
g is best modeled by a linear function, because the rate of change over consecutive equal-length input-value intervals is constant.
g is best modeled by a linear function, because the change in the average rates of change over consecutive equal-length input-value intervals is constant.
g is best modeled by a quadratic function, because the rate of change over consecutive equal-length input-value intervals is constant.
g is best modeled by a quadratic function, because the change in the average rates of change over consecutive equal-length input-value intervals is constant.

The table shows values for a function k at selected values of x. Which of the following statements about k could be true? (74.)
The function k is decreasing and the graph of k is concave up.
The function k is decreasing and the graph of k is concave down.
The function k is increasing and the graph of k is concave up.
The function k is increasing and the graph of k is concave down.

The figure shows the graph of the quartic polynomial function j. How many points of inflection does the graph of j have? (78.)
One
Two
Three
Four

The figure shown is the graph of a polynomial function f. Which of the following could be an expression for f(x)? (81.)
−3(x+4)(x−2)2
−3(x+4)2(x−2)
3(x+4)(x−1)2
3(x+4)2(x−1)

The table gives values of the polynomial function g at selected values of X. Which of the following statements about g could be true? (84.)
(A) g is an odd function and g(-1) = -6
(B) g is an odd function and g(-1) = 6
(C) g is an even function and g(-1) = -6
(D) g is an even function and g(-1) = 6
A polynomial function f is given by f(x)=x(x+3)(x−2)2 . What are all intervals on which f(x)≤0 ? (87.)
(A) (-∞, -3] only
(B) (-∞, -3] ∪ [0, 2]
(C) [-3, 0]
(D) [0, 3]
The polynomial function P is given by p(x)=(x2+4)(x2−9) . Which of the following describes the zeros of P? (95.)
(A) P has exactly two distinct real zeros and no non-real zeros.
(B) P has exactly three distinct real zeros.
(C) P has exactly four distinct real zeros.
(D) P has exactly two distinct real zeros and two non-real zeros.
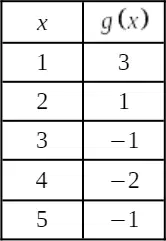
The table gives values of the polynomial function g at selected values of x. What is the least possible degree of g? (99.)
(A) 1
(B) 2
(C) 3
(D) 4

The figure shows the graph of the polynomial function P. A zero of P is 2 - 3i. What is the least possible degree of P? (104.)
(A) Two
(B) Three
(C) Four
(D) Five
The function f is given by f(x)=4x2−2x+7. Which of the following describes the end behavior of f? (105.)
x⟶−∞limf(x)=−∞ and x⟶∞limf(x)=−∞
x⟶−∞limf(x)=−∞ and x⟶∞limf(x)=∞
x⟶−∞limf(x)=∞ and x⟶∞limf(x)=∞
x⟶−∞limf(x)=∞ and x⟶∞limf(x)=−∞
The rational function r is given by r(x)=x4+32x−9 . Which of the following statements about the end behavior of r is true? (118.)
As the input values of r increase without bound, the output values of r decrease without bound.
As the input values of r increase without bound, the output values of r increase without bound.
As the input values of r increase without bound, the output values of r get arbitrarily close to 0.
As the input values of r increase without bound, the output values of r get arbitrarily close to 2.
The rational function r(x)=x(x−3)3x2(x−2)(x−3)2 is given. What are the zeros of the function r? (125.)
x = 2 only
x = 0 and x = 2 only
x = 0 and x = 3 only
x = 0, x = 2, and x = 3
In the xy-plane, the graph of a rational function m has a hole at x = 1. Which of the following could define m(x)? (135.)
m(x)=x−4x−1
m(x)=(x−1)2x−1
m(x)=x−1x−4
m(x)=(x−4)(x−1)(x−1)2
The rational function r(x)=(x−1)(x+3)2(x−1)(x+2) is given. What is the domain of r? (137.)
All real numbers x where x = -2
All real numbers x where x = -2, x ≠ 1
All real numbers x where x = -3, x ≠ 1
All real numbers x where x = -3, x = -2, x ≠ 1
Let f and g be polynomials such that f(x)=3x2+9x+10 and g(x)=x+5 . What is the remainder that results when the polynomial f is divided by the polynomial g? (147.)
-20
6
40
130
Let g(x)=3x2−2x+7(x−2)3−x3 . Which of the following statements about the graph of g is correct? (154.)
The graph of g has a horizontal asymptote of y=−32
The graph of g has a horizontal asymptote of y = 1
The graph of g has a horizontal asymptote of y = -2
The graph does not have a horizontal asymptote
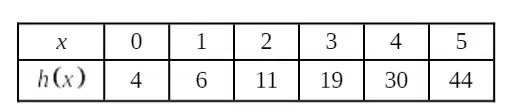
The table shows values for a function h at selected values of x. Which of the following function types best models these data? (179.)
Linear, because these data demonstrate roughly constant rates of change.
Quadratic, because these data demonstrate constant nonzero 2nd differences.
Polynomial greater than degree 2, because these data demonstrate increasing, nonlinear rates of change.
Exponential, because there is a common ratio between consecutive terms.


Calculate the average rate of change from 20 to 40 minutes.
-2 minutes per gallon
-20 minutes per gallon
-2 gallons per minute
-20 gallons per minute

What do "zeros" represent?
something a polynomial can not be.
the place that the polynomial crosses the x axis/ the x value that makes the whole equation equal to zero
the place that the polynomial crosses the y axis/ the y value where x=0
the number zero


Given that f(x) is an even function and that f(−3)=19 , which statement must also be true?
f(3)=19
f(−3)=−19
f(3)=−19
f(19)=−3
Given that g(x) is an odd function and that g(2.5)=4 , which statement must also be true?
g(−2.5)=−4
g(2.5)=−4
g(−2.5)=4
g(4)=2.5

Is the table even, odd or neither?
Even
Odd
Neither

Is the table even, odd or neither?
Even
Odd
Neither
To find zeroes of polynomials, we...
say x=0
make pancakes
ask NASA
set factors equal to zero
The degree of the function is...
the size of it
the number of terms
the greatest exponent on the variable
a BS in mathematics
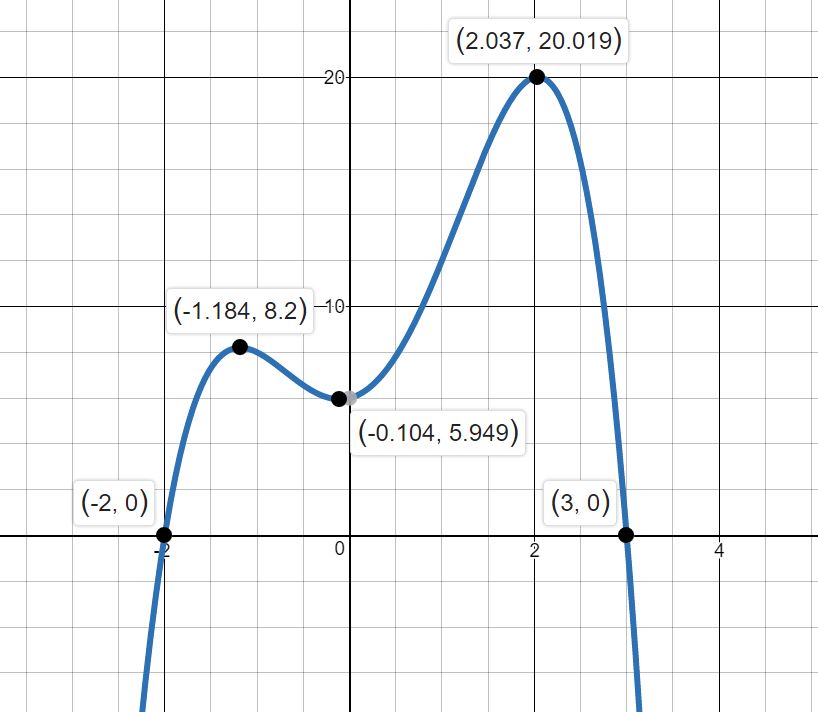

Which function is graphed?
(x - 4)(x + 2)(x - 8)=y
(x - 4)(x - 2)(x + 8)=y
(x - 4)(x + 2)(x + 8)=y
(x + 4)(x + 2)(x + 8)=y
f(x) = (x+2)(x-3)2(x-4)
Which choice best describes the zeros?
-2, 3 (multiplicity 2), 4
-2 (multiplicity 2), 3, 4
2, -3 (multiplicity 2), -4
2 (multiplicity 2), -3, -4

Check ALL the intervals where this graph is decreasing.
(-∞, -1)
(-1, 0)
(0, 1)
(1, ∞)

On what intervals is f(x) increasing?
(- ∞, 0) & (2, ∞ )
(-1, 0) & (2,4)
(0,2) & (-3, -7)
(-8, -3) & (-7, 8)

What interval is f(x) < 0 ?
(1, 3)
(-∞, -2) U (-0.3, 2.2)
(-2, 1)
(-1, 1)

What do we call the point where concavity changes?
Maximum Point
Minimum Point
Inflection Point

Find the point(s) of inflection (if it exists) of the graphed function.
No point of inflection
Points 3 and 5
Points 1, 3, 5 and 7
Points 1, 2, 3, 4, 5, 6 and 7
Points 2, 4 and 6

Determine if the data in the table is best represented by a linear or quadratic function, and why.
LINEAR, because the rate of change over consecutive equal-length input-value intervals is constant.
QUADRATIC, because the rate of change over consecutive equal-length input-value intervals is constant.
LINEAR, because the change in the rates of change over consecutive equal-length input-value intervals is constant.
QUADRATIC, because the change in the rates of change over consecutive equal-length input-value intervals is constant.
Which of the following is an exponential function?
y = x2
f(x) = 3x3
y = x3
f(x) = 3x
What is the initial value in y=4(2)x
4
2
x
What is the y-intercept in y=4(2)x
(4,0)
(0,2)
x
(0,4)
(4,2)

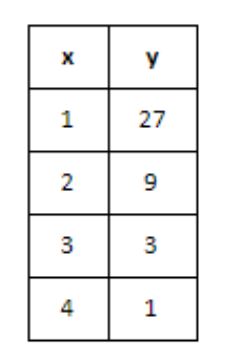
True or False: This is an exponential function.
True
False

Which function models this table?
f(x)=2⋅4x
f(x)=4x
f(x)=4⋅2x
f(x)=8x

Does the table show an exponential function pattern?
Yes, there is a constant factor of 3
Yes, there is a constant factor of 4
No, it is linear there is a constant rate of change of 4
No, there is no pattern
Check all the tables that show exponential DECAY.


How do you know that this was exponential decay? f(x)= 25 ( 0.20)x
Because the 25 was bigger than one
Because the 0.20 was bigger than one
Because the 25 was less than one
Because the 0.20 was less than one
Consider the given function that represents the balance in a bank account.
b(x)=850(1.025)x
What is the initial balance in the account?
(a)
Consider the given function that represents the population of town.
f(x)=22000(0.94)x
Is the population of the town increasing or decreasing?
(a)

What are the zeros and y-intercept of the function?
x-intercepts = 4,1
y-intercept = 3
x-intercepts = 3,1,-2,-5
y-intercept = 3.5
x-intercepts = -3, -1, 2, 5
y-intercept = 3
x-intercepts = -2,4
x-intercepts = -7

How many zeros and y-intercepts are there?
3 zeros
0 y-intercepts
3 zeros
1 y-intercepts
1 zeros
3 y-intercepts
3 zeros
2 y-intercepts
y=2500(1+4.09)4x10
How often is the $2500 being compounded?
monthly
daily
weekly
quarterly
y=1350(1+4.02)4x5
How many years is the $1350 in the account for?
1 year
2 years
4 years
5 years
y=550(1+12.055)12x10
What is the interest rate the $550 is being invested at?
5.5%
12%
55%
10%
Convert to vertex form:
y = x2 + 4x + 10
y = (x + 4)2 + 6
y = (x + 2)2 + 6
y = (x + 4)2 - 6
y = (x + 2)2 - 6
Convert to vertex form:
y = x2 + 8x + 2
y = (x + 4)2 - 14
y = (x + 4)2 - 6
y = (x + 4)2 - 18
y = (x + 4)2 + 6
Convert to vertex form:
y = x2 + 8x - 1
y = (x + 4)2 - 17
y = (x + 4)2 - 16
y = (x + 4)2 - 9
y = (x + 4)2 - 15
Convert to vertex form:
y = x2 + 10x + 23
y = (x + 5)2 - 2
y = (x + 5)2 + 2
y = (x + 5)2 + 13
y = (x + 5)2 - 13
What is the vertex of this parabola?
y = 2(x - 3)2 + 4
(3, 4)
(-3, 4)
(3, -4)
(-3, -4)

What is the axis of symmetry in the function f(x) = (x-1)2 +2
x = 1
x = -1
x = 2
x = -2
f(x)=4(x-2)2 + 3

Describe the end behavior of the function.


Describe the end behavior of the function.

Describe the end behavior of the function.

Describe the end behavior of the function.

Describe the end behavior of the function.

Divide
2x3 + 3x + (7/x-4)
2x2 + 3x + 8 + (7/x-4)
2x2 + 3x + 8
2x2 - x + 10 + (6/x-4)
Divide. Write you solution in standard form. If there is a remainder, write in fractional form.
(x3−5x2−16x−4)÷(x+2)
Divide. Write you solution in standard form. If there is a remainder, write in fractional form.
(36x3+55x2+76x−10)÷(9x−2)

What are the zeros?
What would the horizontal asymptote be for the following rational function:
f(x)=x2−2x+1x2−4x+3y=0
y=1
y=2
none
What would the horizontal asymptote be for the following rational function:
f(x)=x3−2x+1x2−4x+3y=0
y=1
y=2
none
What would the horizontal asymptote be for the following rational function:
f(x)=x2−2x+1x3−4x+3y=0
y=1
y=2
none

What is the equation of the horizontal asymptote?
y = 0
y = -2
y = 2
There isn't one

Find the x-intercept(s), if one exists.
(1, 0)
(-1, 0)
(1, 0), (-1, 0)
(0, 0), (1, 0)

What is the equation of the vertical asymptote?
x = 0
x = 4
x = -1, x = 4
x = -1

What's the vertical asymptote of the function?
x = 5
x = 0
x =5 , x = -5
x = 25
What (if any) holes exist? What are the zero/s of the function?
HINT: To get started, factor both the numerator and denominator of the function.
Hole x=2 Zero x = -2
Holes x=2 and x=3 Zeros None
Hole x=-3 Zeros x=2 and x=-2
Hole x=2 Zeros x=2 and x=-2

Pink
Gastrocnemius
Biceps Femoris
Sartoris
Spinodeltiod

Blue
Lateral Head of Triceps Brachii
Levator Scapula
Long Head of Triceps Brachii
Brachioradialis

Yellow
Latissimus Dorsi
External Oblique
Rectus Abdominus
Sartorius

green
Acromiotrapezius
Clavotrapezius
Biceps Femoris
Sartorius

