
 Worksheets
8.4C-Practice
Total questions: 38
Worksheet time: 1hrs 16mins
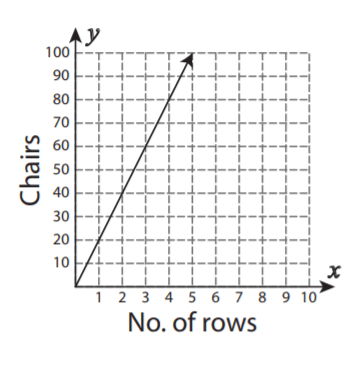
Find the unit rate for this graph.
40
2
20
1
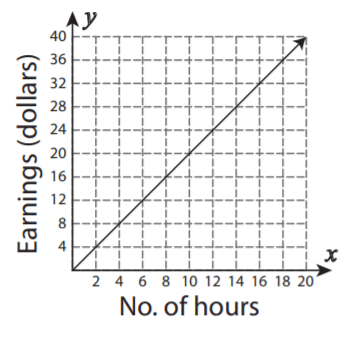
How much money does Rico earn each hour of doing chores?
2
4
6
8
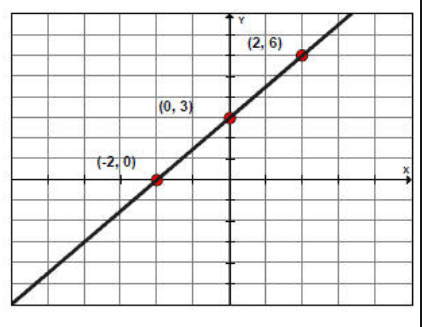
What is the y intercept of this graph?
(6,2)
(-2,0)
(2,6)
(0,3)
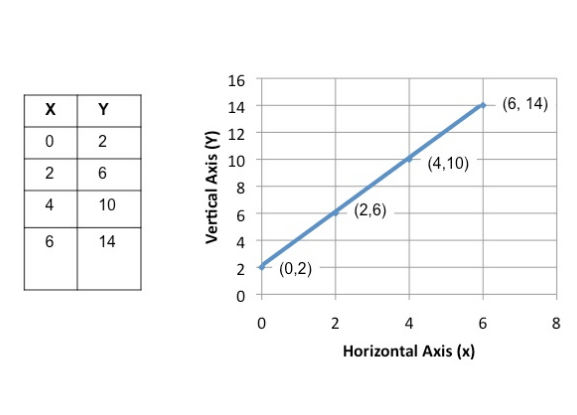
Using the table and the graph, identify the y intercept.
(0,2)
(2,6)
(4,10)
(6,14)
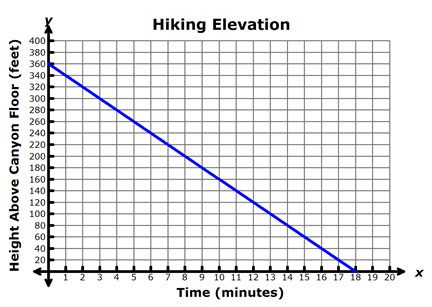
What does the y intercept mean on this graph?
It took the hiker 18 minutes to reach the bottom.
It took the hiker 360 minutes to reach the bottom.
The hiker started out at a height of 360 feet.
The hiker started out at a height of 18 feet.
Theresa earns $10.00 for every hour she tutors Math to her friends. Which graph models a relationship with the same unit rate?

F

G

H

J

Robin went to an amusement park on her vacation. The table below shows the cost of her amusement park visit. Which statement is true?
A. The cost per ride is $5.50.
B. The cost per ride is $3.
C. The cost of admission is $5.50
D. The cost of admission is $3.

An aquarium is being filled with water. The graph shows the height of the water over time as the aquarium is being filled. Which statement best describes the rate of change for this situation?
The height of the water increases 20 inches per second.
The height of the water increases 1 inch per second.
The height of the water increases 5 inches per second.
The height of the water increases 2.5 inches per second.

The table shows the linear relationship between the number of hours Francis worked, x, and the amount of money Francis earned, y. Based on the table, how much did Francis earn per hour? (Find the constant rate of change, divide y by x)
A. $17.50 per hour
B. $14.00 per hour
C. $35.00 per hour
D. $24.50 per hour

A company sells bottles of vitamin capsules. The graph and table show the linear relationship between the cost per capsule in cents and the number of bottles ordered. What is the slope of the line that models this situation?
(a)

Which description best represents the data in the table?
A. One American dollar is equivalent to 23.5 Canadian dollars.
B. A baby measures 22 inches long at birth. The baby grows 1.5 inches each month for 3 months.
C. Jenny has $22 in her bank account. She spends $1.50 every day.
D. A plant grows at a rate of 3 centimeters per month.

Where would the graph of a line representing the relationship in the table intersect the y-axis?
F. (0, 1.5)
G. (1.5, 0)
H. (22, 0)
J. (0, 22)

The rotor in a lawn mower engine spins at a constant rate under normal operating conditions. Under normal conditions, how many revolutions does the rotor spin per minute?
A. 875 revolutions per minute
B. 3,500 revolutions per minute
C. 1,750 revolutions per minute
D. 750 revolutions per mintute

A supermarket advertises a new product by offering samples to customers. the table shows the number of samples distributed each hour. At what rate does the supermarket distributes samples?
A. 36 samples per hour
B. 28 samples per hour
C. 38 samples per hour
D. not here

What is the rate of change for the data shown?
A. 3
B. 6
C. 2
D. ⅙

Claire earns the same pay for each day she works at her new job. She deposits a weekly paycheck into her savings account. How much money did Claire have in her savings account before starting her new job? (find the y-intercept, NOT SLOPE)
$10
$24
$26
$120
What is the y intercept of this graph?
(6,2)
(-2,0)
(2,6)
(0,3)
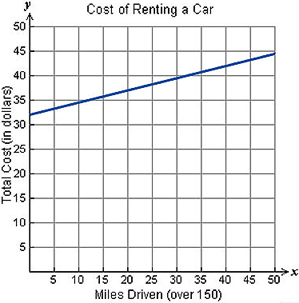
Given y = mx+b, what does the y intercept mean in this scenario?
Cost per mile
Total miles driven
Total cost
Initial car rental fee
A car travels at a constant speed. If it covers 150 miles in 3 hours, what is the speed of the car in miles per hour?
30 miles per hour
75 miles per hour
50 miles per hour
60 miles per hour

A linear function is represented on the coordinate grid. What is the y-intercept of the graph of this function (equation)?
5
6
−87
−78

The table shows the number of gallons of gasoline in a car's gas tank after the car has been driven x miles. When these data are graphed on a coordinate grid, the points all lie on the same line. What are the slope and y-intercept of this line?
Slope = ¹∕₂₅ ; y-intercept= 375
Slope = - ¹∕₂₅ ; y-intercept= 15
Slope = 25 ; y-intercept= 375
Slope = -25 ; y-intercept= 15
Pamela rode her bike at a constant rate of 0.1 kilometers per minute. Which table represents y, the number of kilometers Pamela rode her bike in x minutes?


A dog eats 1.25 cups of food twice a day. Which graph best represents this relationship?


Which of these does NOT represent the distance a car travels when going 55 miles per hour?
d = 55t, where d represents distance in miles and t represents time in hours

In 3 hours a car will travel a distance of 160 miles.

find the slope of the graphed line that contains the given ordered pairs: (8, 7) and (2, 12)
(a)
find the slope of the graphed line that contains the given ordered pairs: (1, 4) and (0, 11)
(a)
A graphed line has a slope of 35 . Which of the following points could the line NOT contain?
(15, 13) and (0, 4)
(3, 9) and (6, 14)
(0, 4) and (19, 9)
(5, 7) and (10, 10)

What is the slope in the table?
(a)

An interior designer charges customers an initial consultation fee plus an hourly rate. The table shows the linear relationship between x, the number of hours, and y, the total cost of hiring the designer. What is the rate of change?
(a)

Choose two ordered pairs from the table and use the slope formula to find the rate of change.
(a)
Which graph has a slope of 21 ?


The graph shows the linear relationship between number of bagels a bagel shop has remaining, and the number of customers served so far that day. Find the rate of change of bagels remaining with respect to the number of customers served.
(a)
The slope of a vertical line will always be ______________.
Positive
Undefined
Zero
Negative
A graph with a _______ slope decreases from left to right.
Positive
Undefined
Zero
Negative
The slope of a horizontal line will always be _______.
Positive
Undefined
Zero
Negative
A graph with a __________ slope increases from left to right.
Positive
Undefined
Zero
Negative

What is the slope of the line in the graph?
32
−3
43
−25
0

What answer choices are NOT the slope of the given line?
32
−3
43
−25
0

