
 Worksheets
Pre Cal SLO
Total questions: 25
Worksheet time: 2hrs 5mins
Name
Class
Date
1.
How the graph of y=32∣x∣ different from the graph of y=∣x∣ ?
a)
Vertical Shrink
b)
Horizontal Shift Left
c)
Horizontal Shift Right
d)
Vertical Shift Up
e)
Vertical Shift Down
2.
How the graph of y=(x−3)4 different from the graph of y=x4 ?
a)
Horizontal Shift Right
b)
Horizontal Shift Left
c)
Vertical Shift Up
d)
Vertical Shift Down
e)
Vertical Stretch
3.
How the graph of y=4x−2 different from the graph of y=4x ?
a)
Vertical Shift Down
b)
Horizontal Shift Left
c)
Horizontal Shift Right
d)
Vertical Shift Up
e)
Vertical Stretch
4.
How the graph of y=−x different from the graph of y=x ?
a)
Reflection Across x-axis
b)
Horizontal Shift Left
c)
Horizontal Shift Right
d)
Vertical Shift Up
e)
Vertical Shift Down
5.
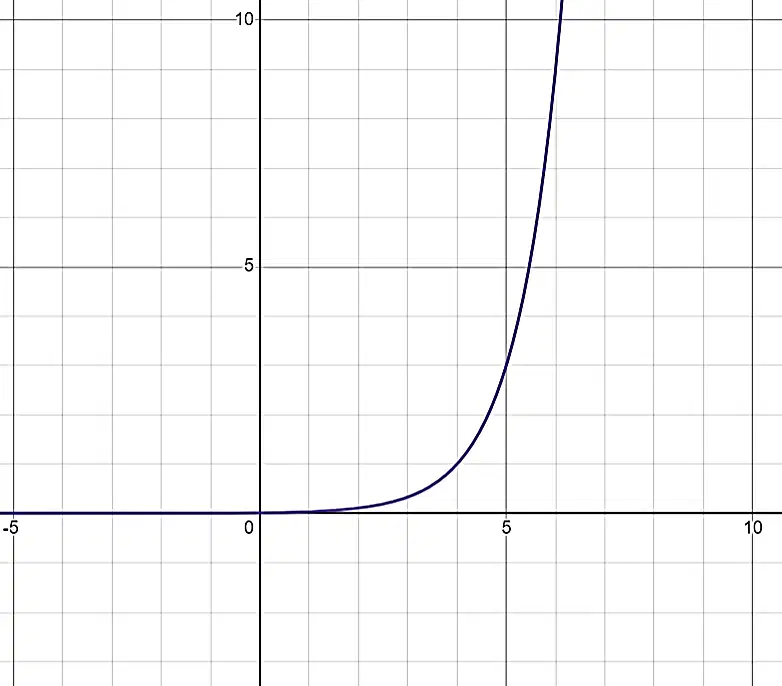
Choose the equation a transformed exponential parent function given the graph.
a)
A
b)
B
c)
C
d)
D
6.

Use the table to identify the key features. Assume the table models a function that is continuous over the domain and the domain is [-4,2].
Identify the x-intercept(s) of the function.
a)
(-3,0)
b)
(-3,0) and (0,-5)
c)
(-3,0, and (1,0)
d)
(0,-5)
e)
None
7.

Use the table to identify the key features. Assume the table models a function that is continuous over the domain and the domain is [-4,2].
Identify the y-intercept(s) of the function.
a)
(-3,0)
b)
(-3,0) and (0,-5)
c)
(-3,0, and (1,0)
d)
(0,-5)
e)
None
8.

Use the table to identify the key features. Assume the table models a function that is continuous over the domain and the domain is [-4,2].
Identify the value of the absolute minimum of the function.
a)
None
b)
0
c)
-5
d)
-10
9.

Use the table to identify the key features. Assume the table models a function that is continuous over the domain and the domain is [-4,2].
Identify the value of the relative maximum of the function.
a)
None
b)
0
c)
-5
d)
5
10.
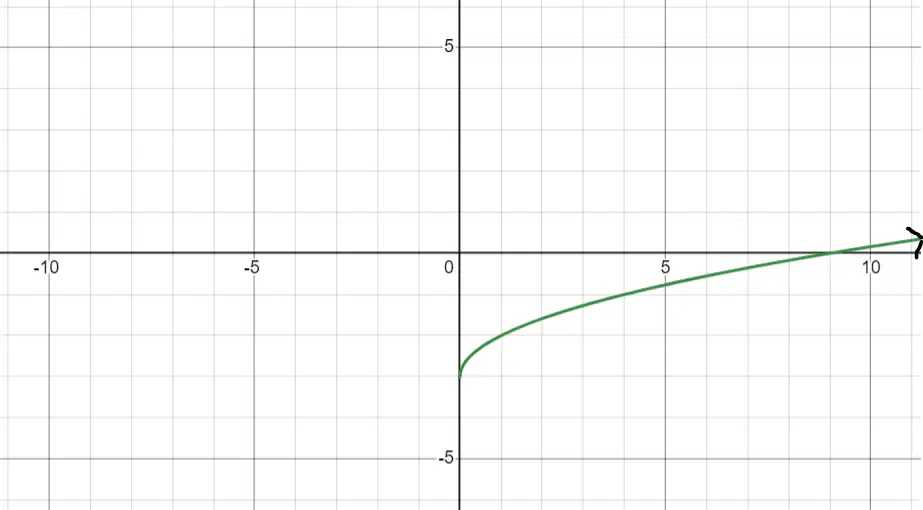
Describe the domain of the graph below using interval notation.
a)
(−∞,∞)
b)
(−3, ∞)
c)
[−3,∞)
d)
(0,∞)
e)
[0,∞)
11.
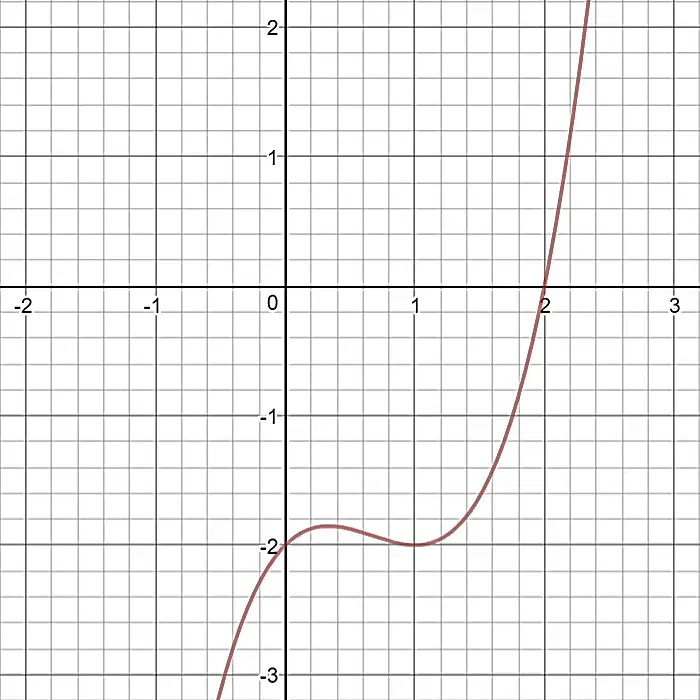
Use the graph to identify the key features.
Identify the zero(s).
a)
-2
b)
-2, 2
c)
2
d)
None
12.
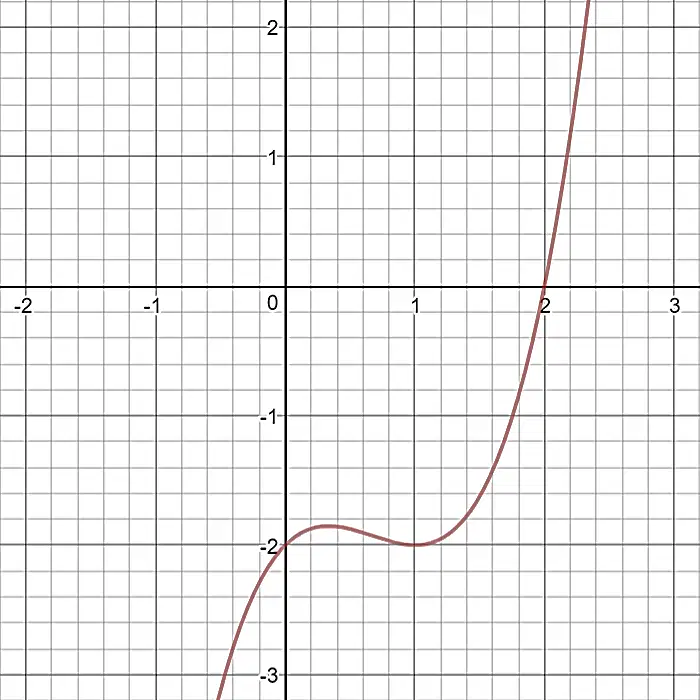
Use the graph to identify the key features.
Identify the y-intercept(s).
a)
(-2,0)
b)
(0,-2)
c)
(2,0)
d)
None
13.
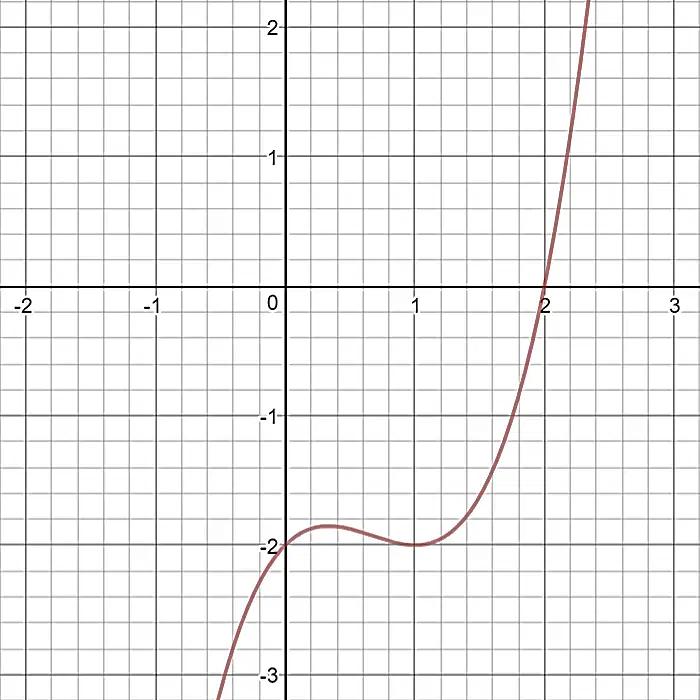
Use the graph to identify the key features.
Identify the absolute maximum.
a)
None
b)
-2
c)
1
d)
−∞
14.
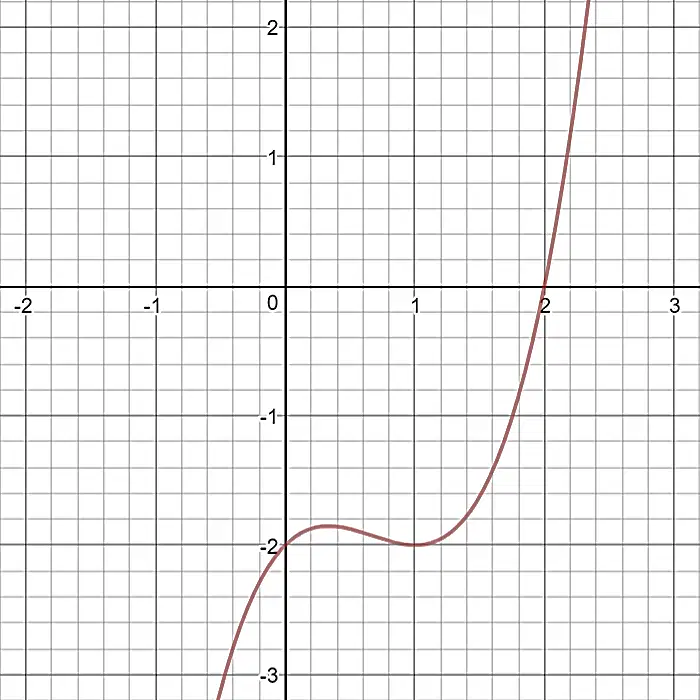
Use the graph to identify the key features.
Identify the interval(s) where the function is negative.
a)
(−∞,∞)
b)
(−∞,2)
c)
(2,∞)
d)
None
15.
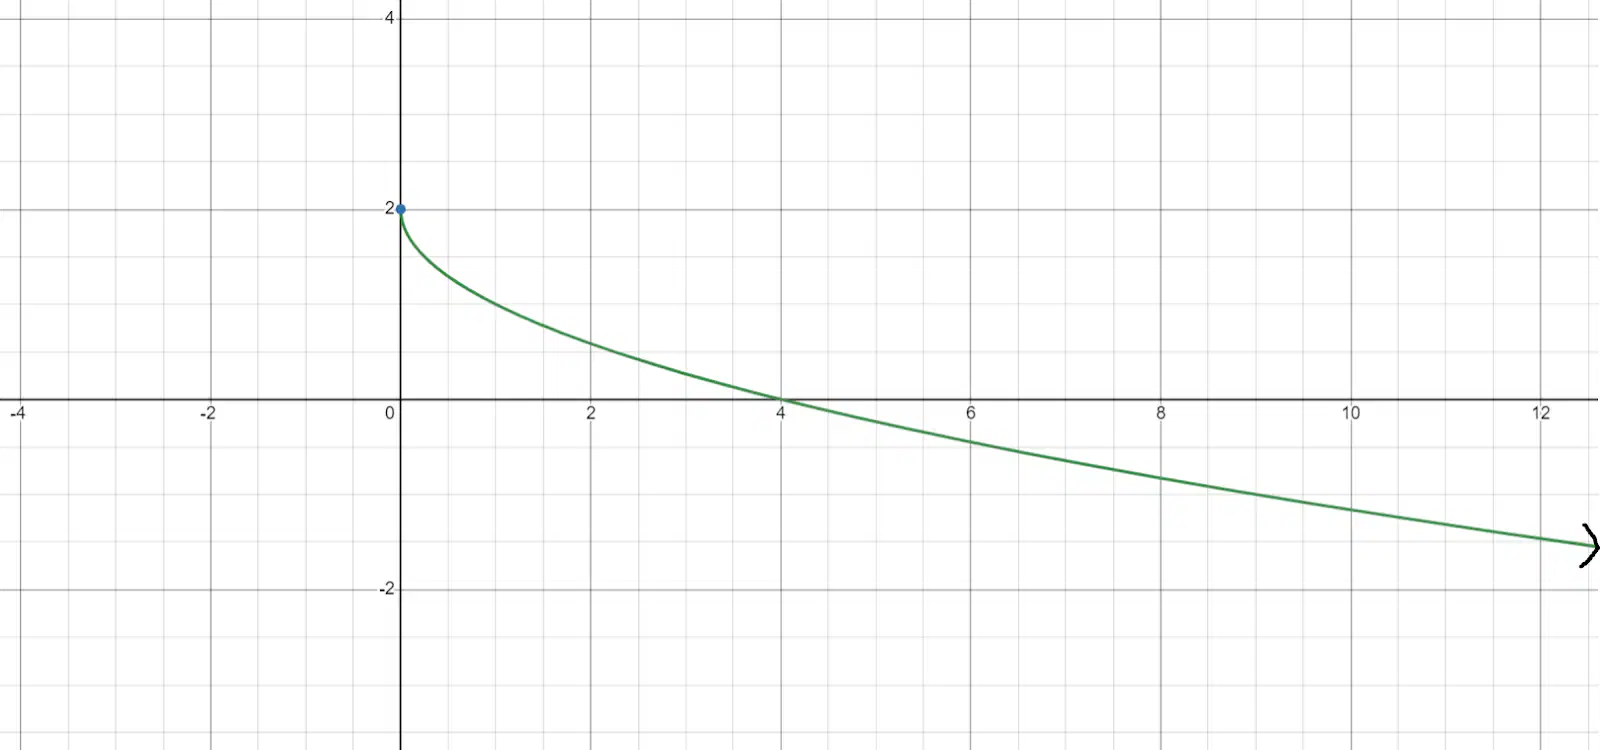
Use the graph of a radical function to identify the key features.
Identify the relative maximum.
a)
2
b)
0
c)
4
d)
None
16.
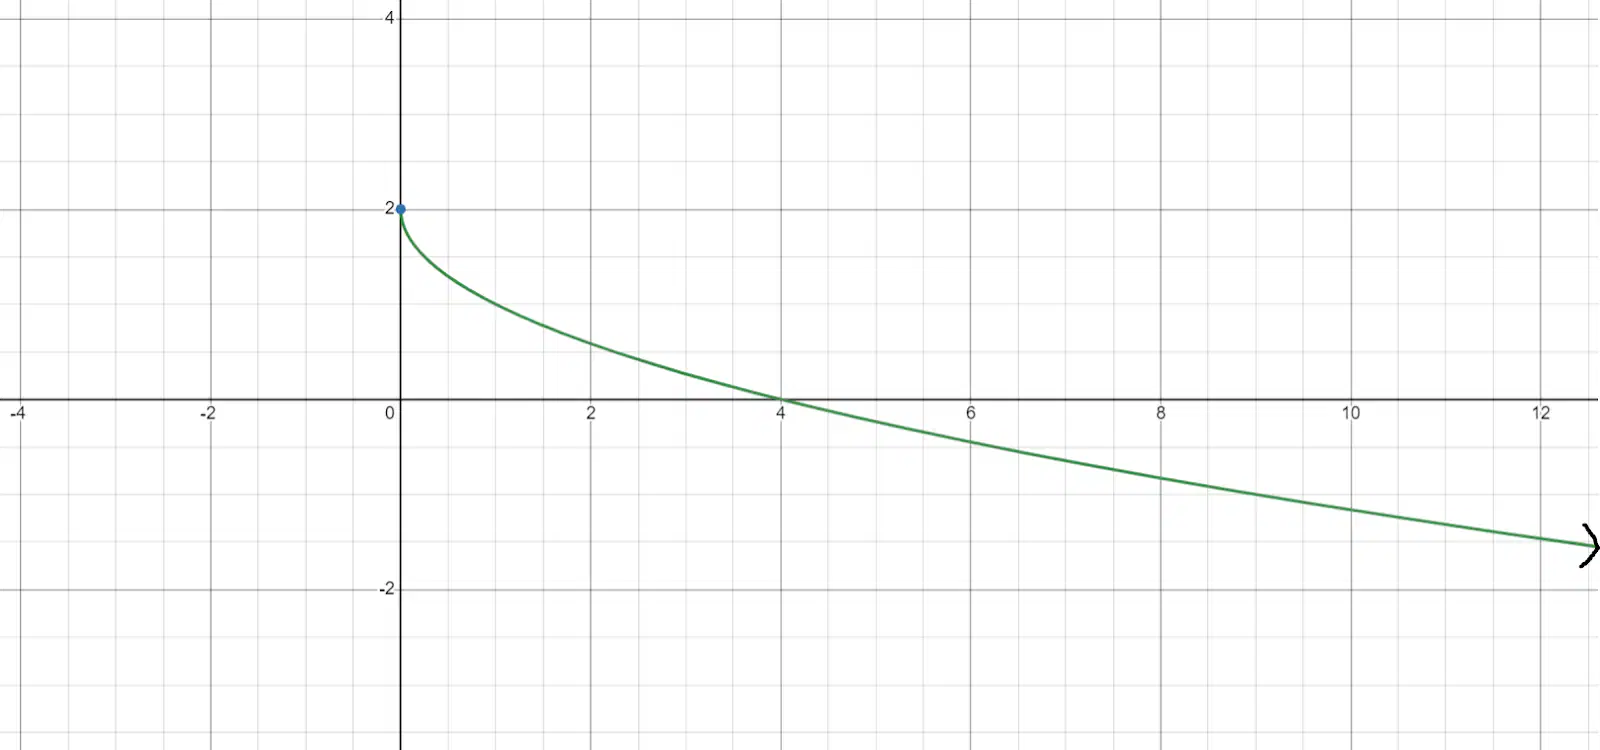
Use the graph of a radical function to identify the key features.
Identify the end behavior.
a)
A
b)
B
c)
C
d)
D
17.
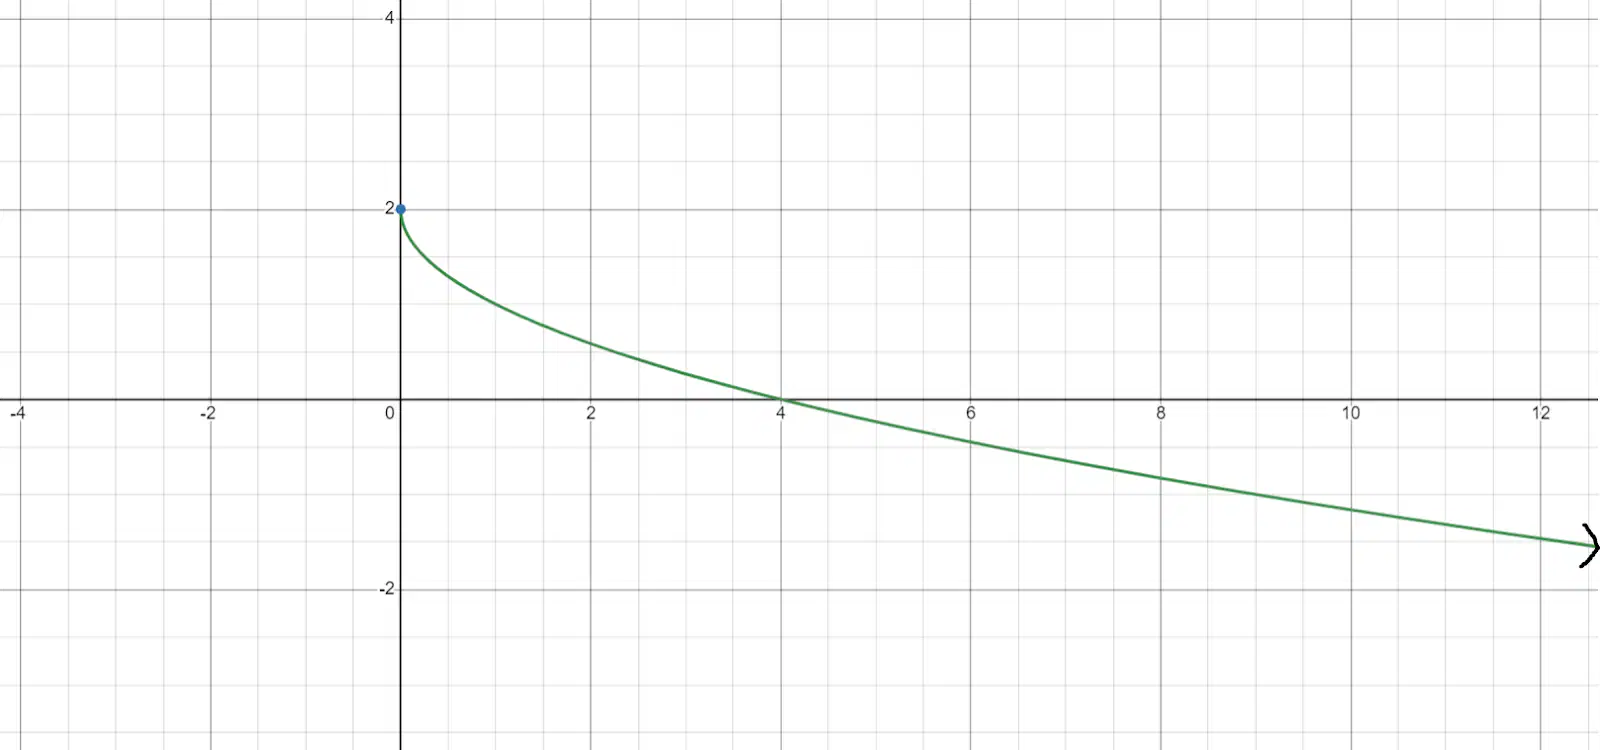
Use the graph of a radical function to identify the key features.
Identify the interval(s) where the function is decreasing.
a)
None
b)
(−∞,∞)
c)
(2,∞)
d)
(0,∞)
18.
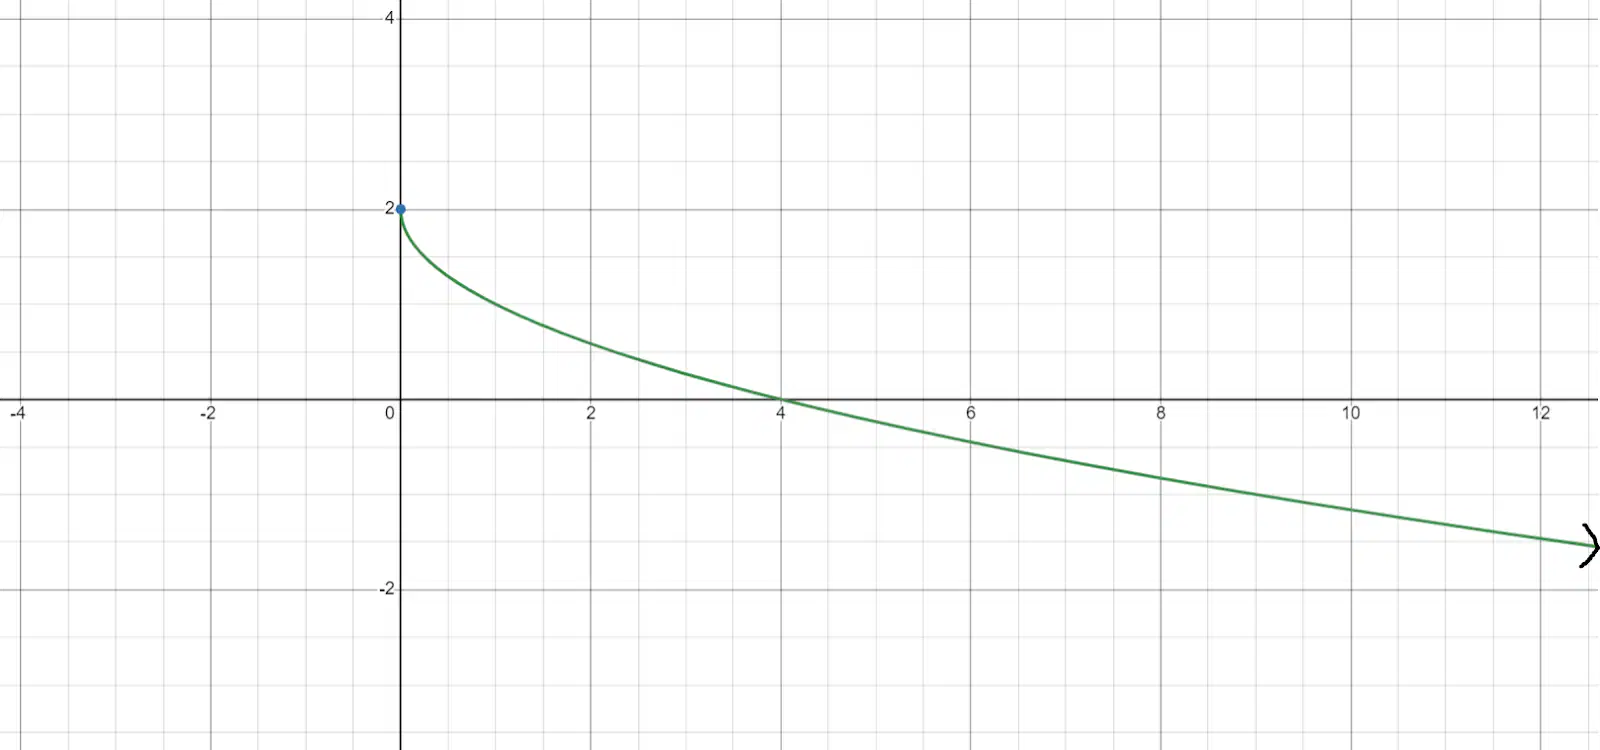
Use the graph of a radical function to identify the key features.
Identify the range.
a)
(−∞,2]
b)
(−∞,2)
c)
(−∞,∞)
d)
[0,∞)
19.
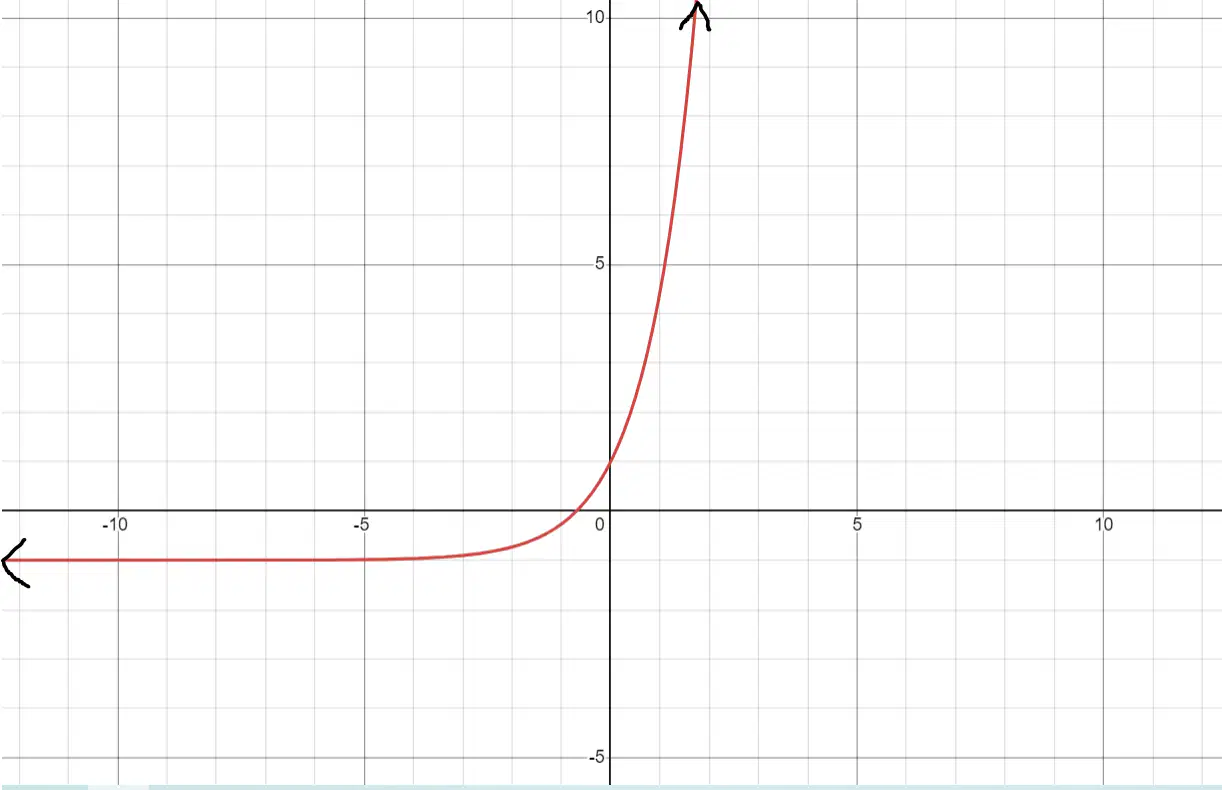
Use the graph of an exponential equation to identify the key features.
Identify the horizontal asymptote.
a)
y=-1
b)
x=-1
c)
y=1
d)
None
20.
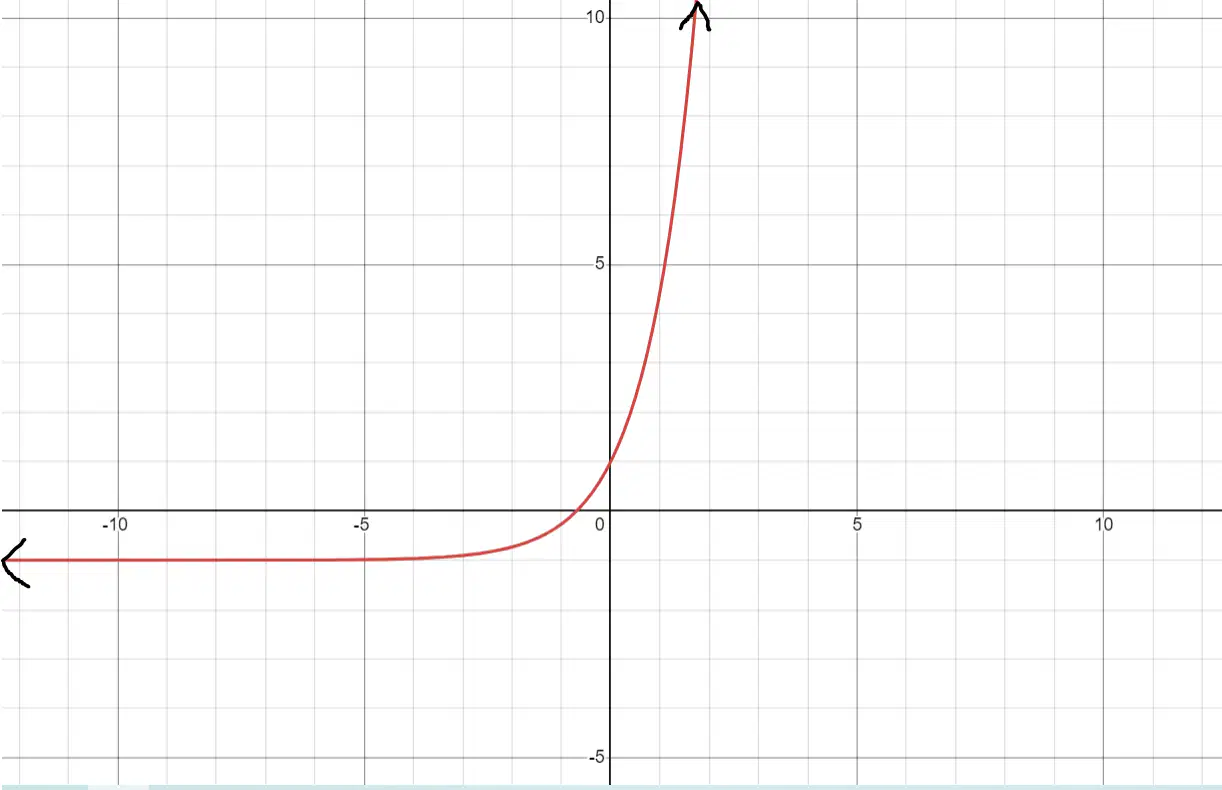
Use the graph of an exponential equation to identify the key features.
Identify the domain.
a)
(−∞,−1]
b)
(−1,∞)
c)
(−∞,1)
d)
(−∞,∞)
21.
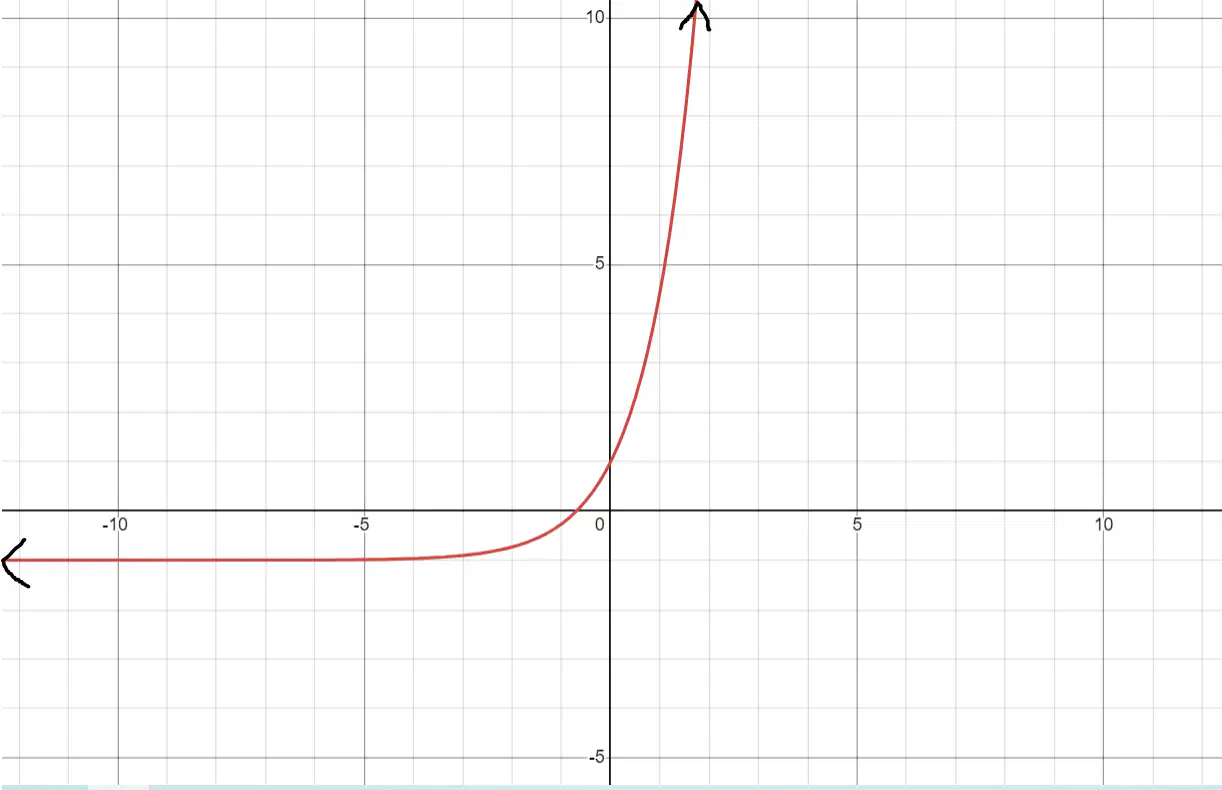
Use the graph of an exponential equation to identify the key features.
Identify the end behavior.
a)
A
b)
B
c)
C
d)
D
22.
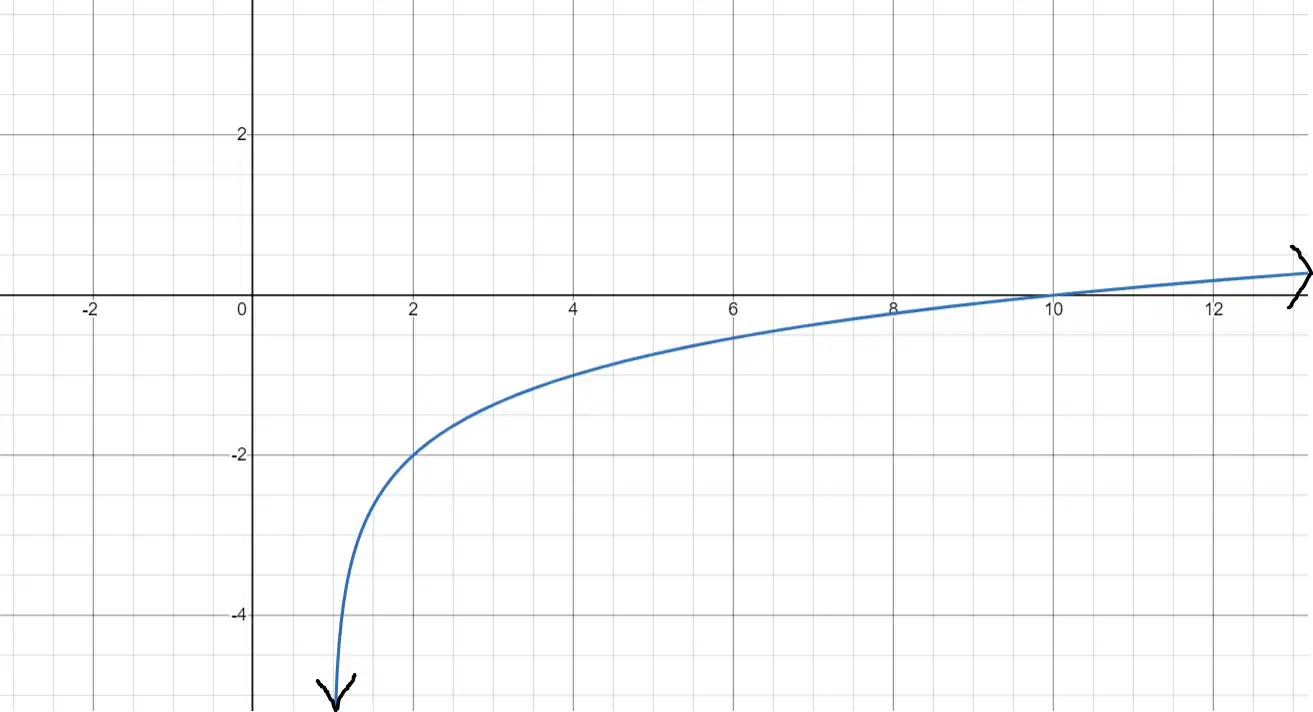
Use the graph of a logarithmic function to identify the key features.
Identify the domain.
a)
(−∞,∞)
b)
(1,∞)
c)
[1,∞)
d)
None
23.
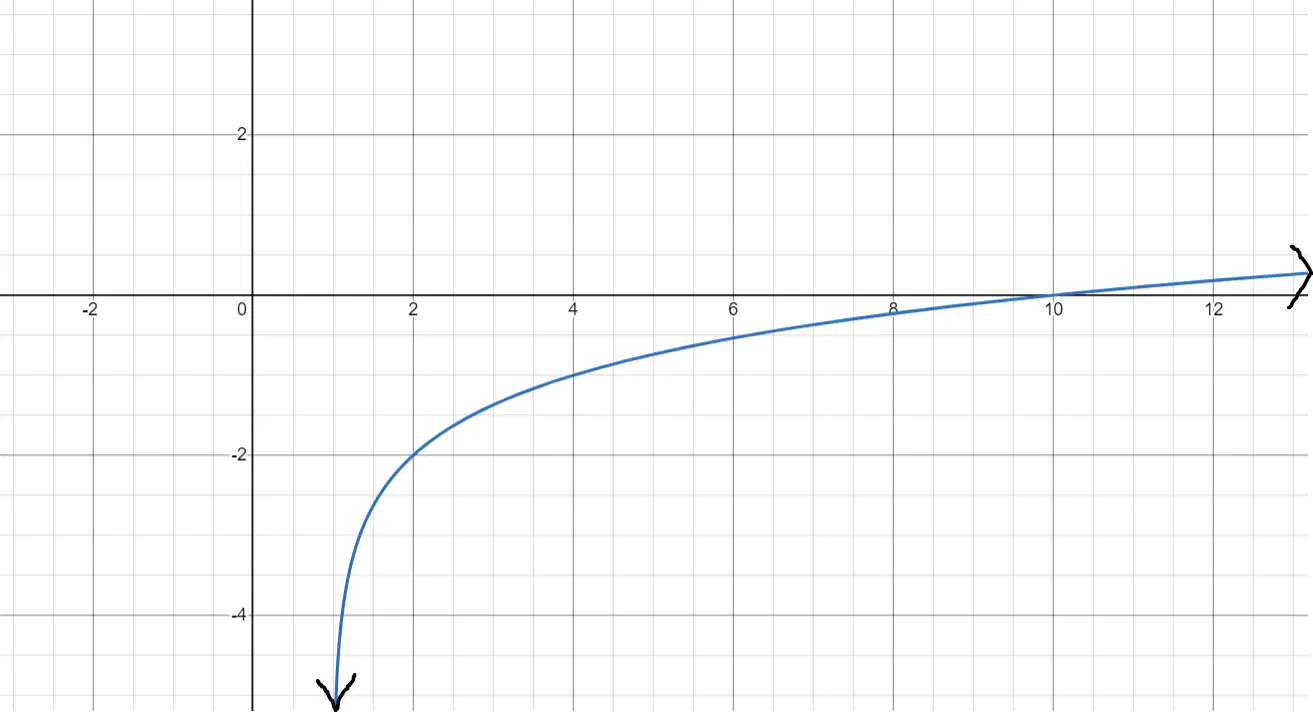
Use the graph of a logarithmic function to identify the key features.
Identify the interval(s) where the function is negative.
a)
None
b)
(10,∞)
c)
(−∞,10)
d)
(1,10)
24.
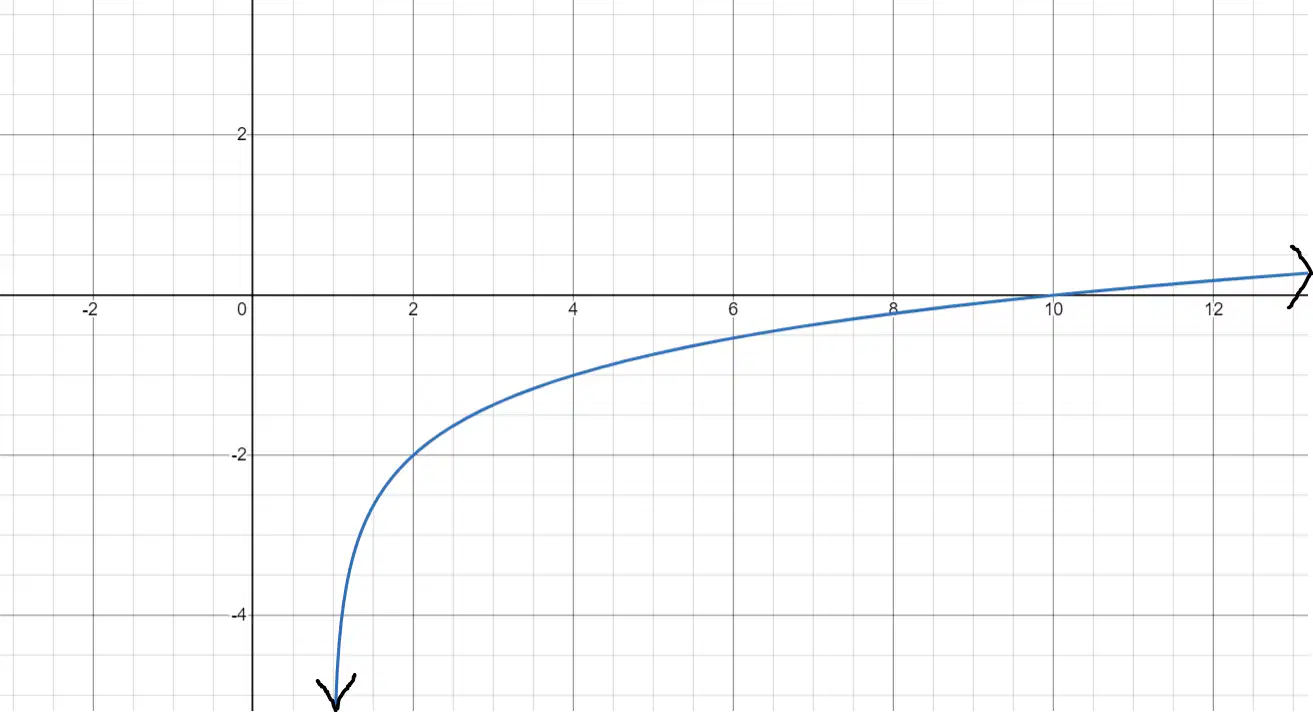
Use the graph of a logarithmic function to identify the key features.
Identify the y-intercept(s).
a)
(0,0)
b)
(10,0)
c)
−∞
d)
None
25.
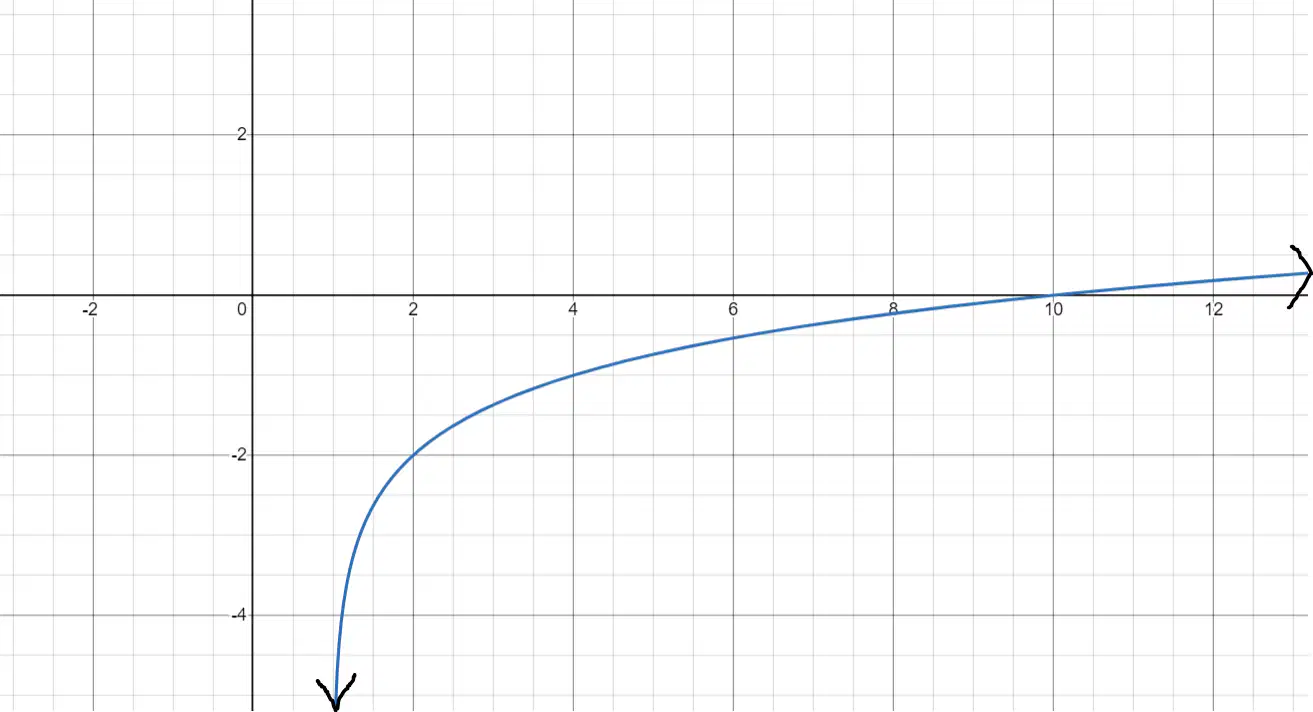
Use the graph of a logarithmic function to identify the key features.
Identify the end behavior.
a)
A
b)
B
c)
C
d)
D
100 %

