Worksheets
Advanced Excel - Midterms
Total questions: 20
Worksheet time: 2hrs 38mins
It is a system, which organizes data in columns and rows. It is a data visualization and analysis tool.
MS Powerpoint
MS Word
MS Excel
MS Teams
A (a) consists of a grid made from columns and rows.
MS Excel files have (a) extension.
MS Excel supports (a) .
A (a) consists of a grid made from columns and rows.
Match the description to the correct Microsoft Excel feature or function.
This formula adds all the numeric values in a range of cells.
Sum
Used to automate tasks
Macros
This chart type displays trend over time.
Line Chart
Allows people to pick an item from a list that you create
Drop-down List
This function is used for data lookup.
VLookup
Match the Microsoft Excel feature or function with its description.
Changes the cell appearance based on format conditions.
Conditional Formatting
Useful for viewing the headers while scrolling
Freeze Panes
Lets you copy formatting from one cell to another.
Format Painter
This table is used for data analysis by summarizing large amounts of data.
Pivot Table
This formula calculates the average.
Average
Categorize the features to the menu where it can be found in MS Excel.
Conditional Formatting
Insert pivot table
Set print area
Text to columns
Data validation
Margins
Orientation
SmartArt
Merge and Center
Recommended Charts
Categorize the features to the correct tab/menu where it can be found in MS Excel.
Freeze Panes
Protect Workbook
Insert Function
Protect Sheet
View Side by Side
Label the parts of MS Excel based on the image.
From the top menu, which would you click to add a pivot table?
Click the conditional formatting option.
Click on "merge and center" icon.
Click on the option to "Protect Workbook".
You need to calculate average length of the products listed in your excel file. Click on the correct function to use.
To calculate the total length, which excel formula will you use?

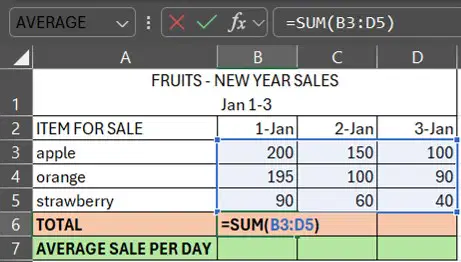
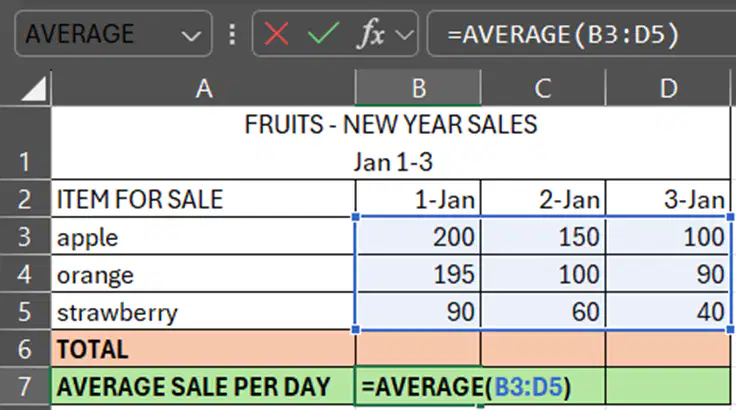
Based on the sales from January 1-3, which formula will you use to calculate Cell B6?
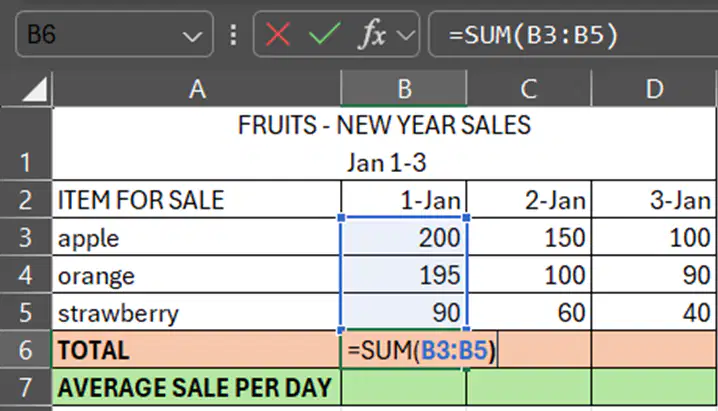

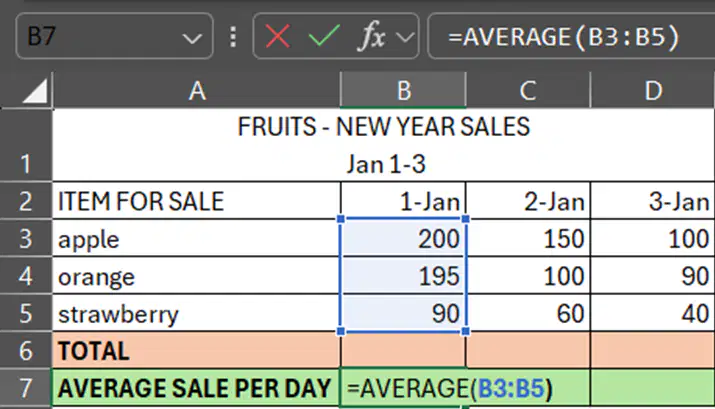
Given the daily sales, how would you calculate the average sales on Jan 1?

Given the number of students in SY 2023-2024 vs. SY 2024-25, how would you calculate the increase in student headcount for BSOA in Cell D3?
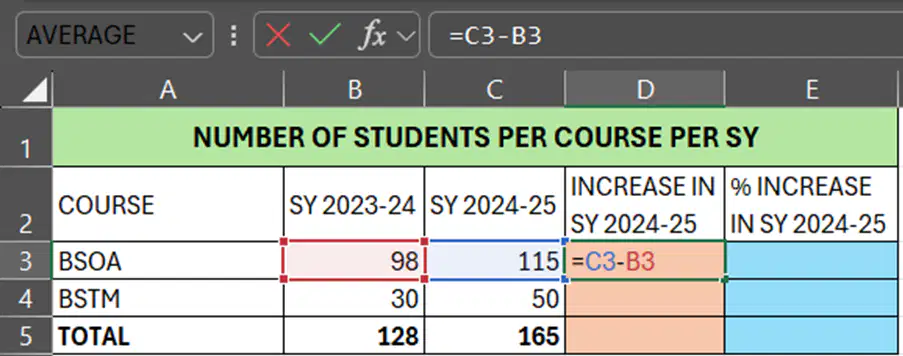
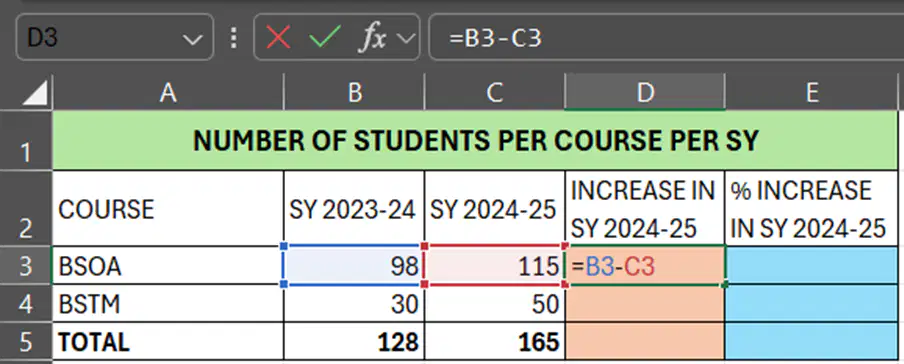

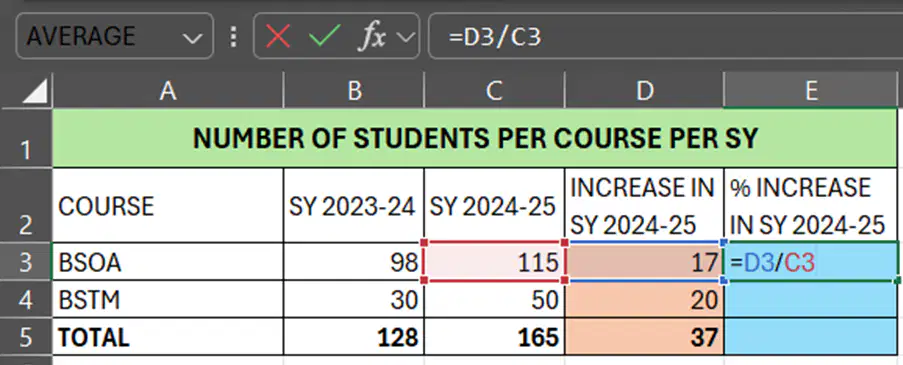
How would you calculate the rate of the increase of the students enrolled in SY 2024-25 vs. SY 2023-24 in Cell E3?