
 Worksheets
Correlation and R Value Review
Total questions: 15
Worksheet time: 19mins
Correlation coefficient is represented by "R".
True
False
The correlation coefficient is a number "r" such that:
-1 < r < 1
-1 > r > 1
-1 ≤ r ≤ 1
-1 ≥ r ≤ 1
If every brother is exactly two inches taller than his sister, what would the correlation between the heights of brothers and sisters be?
Nearly 1
0
Somewhat positive
1
Correlation applies to both quantitative and categorical data.
True
False
Which of the following is true for correlation coefficients?
x is the explanatory variable and y is the response variable.
x is the response variable and y is the explanatory variable.
The choice of x and y as the explanatory and response variables does not matter.

Estimate the correlation coefficient
r = 1
r = -1
r ≈ -0.8
r ≈ 0.8
r ≈ -0.5

Estimate the correlation coefficient for this scatterplot.
A) r = 1.2
B) r = 0.89
C)r = 0
D) r = -0.89
Which graph represents data that has a correlation coefficient close to -1?
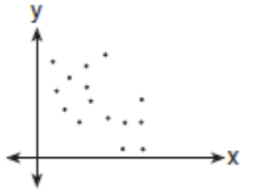
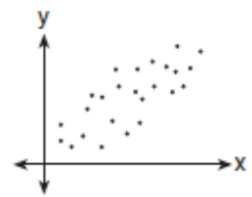
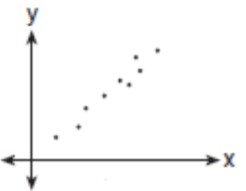
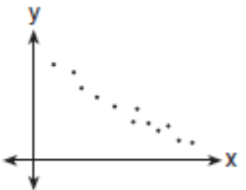
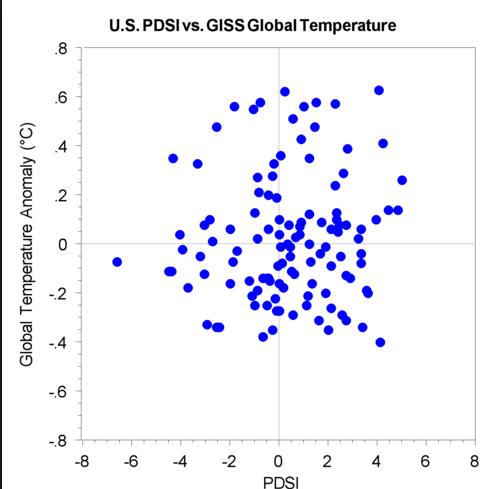
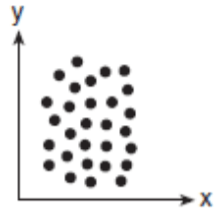
What type of association does this scatter plot represent?
Positive linear association
Negative linear association
No association
Nonlinear association

Which value is the closest to the correlation coefficient for the data?
-0.07
-0.73
0.07
.73
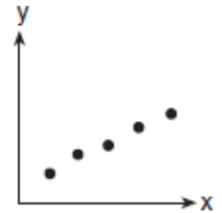
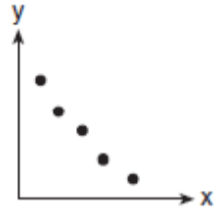
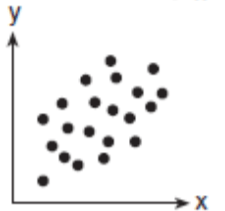
Which scatter plot diagram shows the strongest positive correlation?

The scatter plot shows the number coffee shops in different cities and the number of violent crimes. Which of the following is NOT true?
A) As the number of coffee shops increase, violent crimes appears to increase.
B) The line of best fit (regression line) shows a positive correlation
C) The data has a positive correlation coefficient
D) An increase in coffee shops causes an increase in violent crimes
Which best represents no correlation?
the amount of tea that is drank and level of intelligence.
the temperature and what people wear outside.
how much you study and your grades.
where you signed up for a cell phone plan and your area code.



