
 Worksheets
Proportional Relationships, Graphs and Tables
Total questions: 10
Worksheet time: 48mins
Name
Class
Date
1.
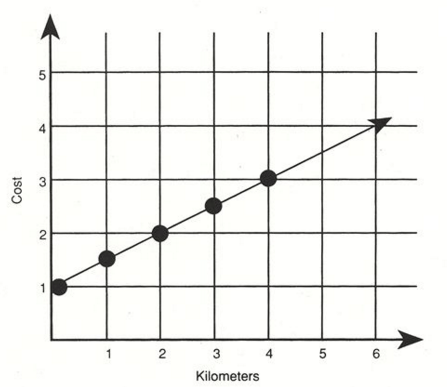
Is the graph proportional or non proportional?
a)
proportional
b)
non proportional
2.

Is the graph proportional or non proportional?
a)
proportional
b)
non proportional
3.

Why does this graph show a non-proportional relationship?
a)
Because it is proportional
b)
It goes through the origin
c)
It does not go through the origin
d)
It is a straight line
4.
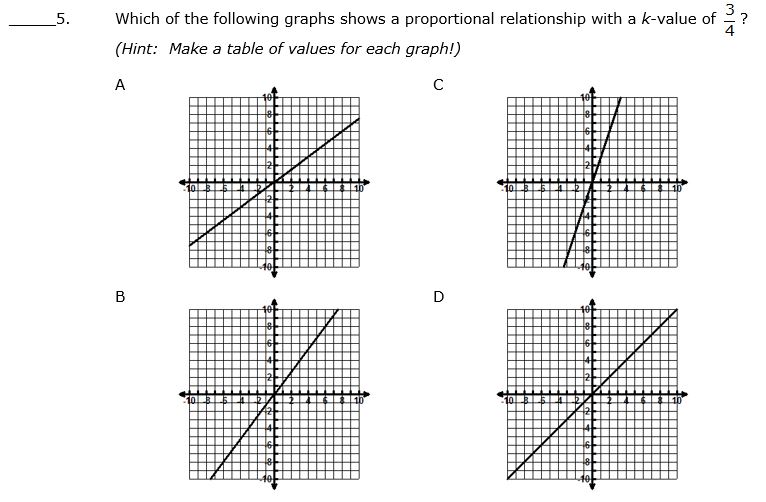
Which graph is proportional?
a)
A
b)
B
c)
C and D
d)
All of the graphs are proportional
5.

REVIEW QUESTION
Is this table proportional or non-proportional?
Is this table proportional or non-proportional?
a)
Proportional
b)
Non-Proportional
c)
both
d)
neither
6.
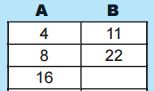
This is a table with a proportional relationship between A and B. Find the missing value of B.
a)
33
b)
44
c)
32
d)
48
7.

What is the constant of proportionality?
a)
$3
b)
$4
c)
$2
d)
$9
8.

Solve the proportion.
a)
1
b)
3
c)
6
d)
5
9.
A 6-ounce package of fruit snacks contains 45 pieces. How many pieces would you expect in a 10-ounce package?
a)
75 Pieces
b)
27-ounces
c)
27 pieces
d)
75-ounces
10.
Jeff ran 6 miles in 4 hours. At this rate, how many miles will he run in 6 hours?
a)
9 miles
b)
4 miles
c)
6 miles
d)
36 miles
100 %

