
NEW
Font size
 Worksheets
Graphing Linear Inequalities Standard Form
Total questions: 24
Worksheet time: 1hrs 8mins

Which graph best represents the following inequality?


Determine whether point A is a solution to the linear inequality that is shown.
Yes
No
Sometimes
Determine whether point (-4,0) is a solution to the linear inequality that is shown.
Yes
No
Sometimes

What graph matches this inequality?


What graph matches this inequality?


What inequality matches the graph?


Alicia has at most $196 to buy a new baseball glove and a
new baseball bat. Which inequality represents this situation?
y ≤ 196 – x
y ≤ 196 + x
196 ≤ y + x
y – x ≥ 196
Beng and Shim have less than $30 for candle–making supplies. The molds x cost $6 each and the wax y is $2 per pound. Which point represents a reasonable number of molds and pounds of wax they could buy?
(3, 4)
(4, 4)
(5, 1)
(3, 6)

An inequality is solved as shown below. Between which two steps is an error made?
Between Step 1 and Step 2
Between Step 2 and Step 3
Between Step 3 and Step 4
Between Step 6 and Step 7
Between Step 7 and Step 8


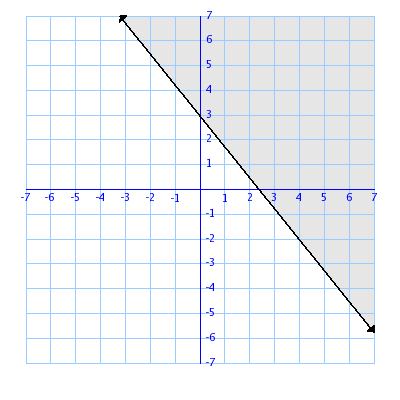


y=-3x

Is the point (3, 1) a solution for the following inequality? Choose the best answer that has the best explanation.
Yes because it is located in the shaded region.
No because it is located on the line and the line is dotted.
Yes because it is located on the line.
No because it is in the shaded region.
When I see ≤ or ≥ , I use a ________ line.
Solid
Dashed
When I see < or > , I use a ____________ line.
Solid
Dashed

Which of the following is NOT a solution to the inequality graphed below?
(4, 3)
(-6, 0 )
(0, 0)
(0, 2)
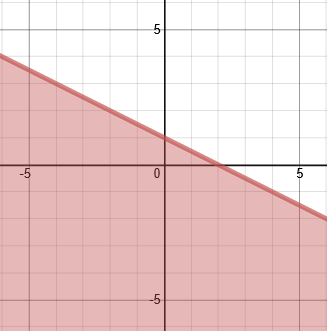
Determine whether point (-2,-3) is a solution to the linear inequality that is shown.
Yes
No
Sometimes

